Category: Black-White IQ Gap (Page 6 of 7)

HVGIQ: The Bahamas

The Bahamas is one of the most prosperous nations in the world (Third highest GDP per capita in the Americas, behind the US and Canada), with an economy, much like the Cayman Islands, primarily dependent upon tourism and finance. The population, not much larger than 350,000, is 85% black, 12% white, and 3% Asian and Latin American.

IQ and the Wealth of Nations (2002) does not have a study for The Bahamas, but estimates an IQ of 78 by using the score from Barbados (p. 74). IQ and Global Inequality (2006) estimates an IQ of 84 by averaging the scores from Cuba and the Dominican Republic (p. 55), and this is the estimate still reported in the most recent book (Lynn & Vanhanen, 2012, p. 20).

Here I discuss measured IQ data for The Bahamas from two different studies. Continue reading

Color Differences: Ubiquitous Yet Understudied

Note: Our analysis has been updated and extended. Refer also to: Color Differences: Corrections and Further Analysis. Part 1

(or Colorism: Game Over)

Introduction

Following up with Dalliard’s pioneering post on colorism, we looked at the relationship between skin color, cognitive ability, and educational attainment in the full NLSY 97 sample (across all racial and ethnic groups). Our purpose was to test what we term “Strong Colorism”. According to “Strong Colorism”, color discrimination is a unifying explanation for sub-population differences in the US and beyond; it is a generalized phenomenon that can account for pigment related outcome differences. Lest readers suspect that a straw position is being constructed, below is an excerpt from an article, recently published in the journal of Industrial and Organizational Psychology, discussing this model (which the authors take to be established):
Continue reading

HVGIQ: Jamaica

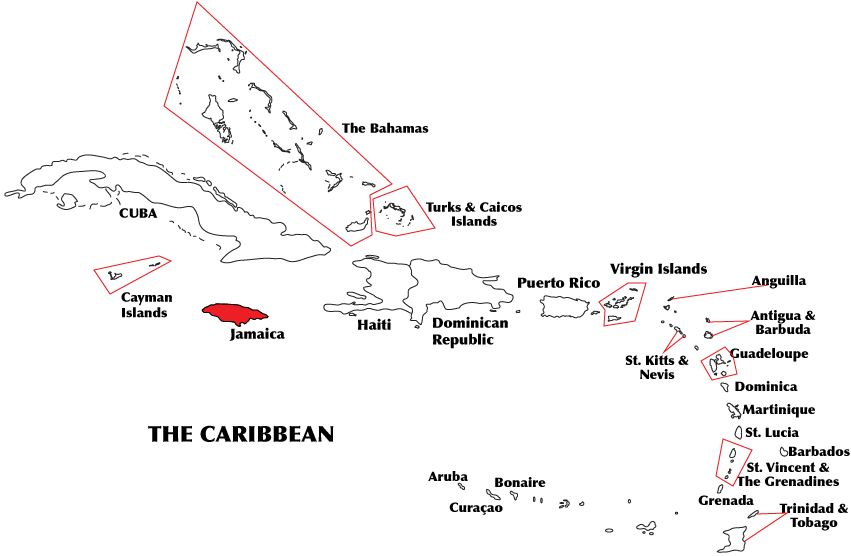
IQ and the Wealth of Nations (2002) cites one study for Jamaica (Manley, 1963 ). The sample size is nearly two thousand school children, and the reported IQ is 72 (p. 209). Lynn’s various updates to that book have included five additional references. However, in another anomaly, the most recent book contains only two references, both with relatively small sample sizes, and omits the large study altogether. The IQ estimate for Jamaica has also been lowered to 67! (Lynn, 2012, p. 403)

Here I review over 20 intelligence test studies from Jamaica. I find that Lynn’s numbers were not accurately reported, and that IQ is significantly higher in Jamaica than his books have claimed. Continue reading

Colorism in America?

Previously, we established that skin color and intelligence are correlated in the NLSY97 sample as predicted by hereditarian theory. Continuing this investigation, we looked into how these variables go together within and between African American families in the same sample. In other words, we wanted to know if lighter-skinned individuals tend to be smarter than their darker-skinned siblings just as the average light-skinned black in the general population is smarter than the average dark-skinned black. Continue reading

HVGIQ: Cayman Islands

The Cayman Islands is a British Overseas Territory. In global comparison, this tiny dependency ranks near the top in standard of living and per capita GDP (currently sandwiched between the U.S., Ireland, Japan and Iceland). Lynn and Vanhanen’s books include data for Bermuda—another Overseas Territory—but do not mention the Cayman Islands.

At least one psychologist has administered intelligence tests to Cayman Islands school children (1960 Curti ), and this forgotten study is noteworthy because it is also one of the relatively rare instances where black and white IQ scores have been compared outside of the United States, Britain, and South Africa. Continue reading

More than Just “Colorism”: Part 1.

The meaning of a Jensen Effect on the Color Effect

Dalliard showed that IQ correlates with color in both the American Black and Hispanic populations (a color effect) and, importantly, that the IQ-color correlations are positively related to a subtest’s general intelligence loading (a Jensen effect). In short, he showed that there was a Jensen effect on the IQ color effect. This is significant for reasons elaborated elsewhere. Generally, if an IQ difference is strongly positively correlated with g – is g(+) – biological causation is implicated; alternatively, if an IQ difference is strongly negatively correlated with g – is g(-) – cultural causation is implicated. Here, “biological causation” refers to psychophysiological influences on mental states that do not act through sensory informational pathways, while “cultural causation” refers to psychophysiological influences on mental states that act through these pathways; as an example of the general biological versus cultural causal schema, with respect to personality, differences induced by pharmacological agents would be classed as “biological causal” while differences induced by psychotherapy would be classed as “cultural causal.” This schema, of course, isn’t perfect – but it has utility and is not infrequently employed in psychology.
Continue reading

Spearman’s hypothesis and the NLSY97-ASVAB, part 2

Skin color is a (very imperfect) proxy for white ancestry in African Americans and Hispanics. If racial and ethnic gaps in intelligence have a genetic component, we would expect lighter skinned individuals to have higher IQs, on the average. Further, because g is the main heritable component of intelligence, tests with higher g loadings should show larger associations with skin color.

We investigated these hypotheses in the NLSY97 sample. It contains interviewer reports on facial skin tone of the respondents as measured on a scale of 1 (lightest) to 10 (darkest). The interviewers used a “color card” as a reference.

All the correlations below are significant at conventional levels unless otherwise indicated. Because of the way skin color is coded in this analysis, negative correlations between skin color and test performance are expected if the hereditarian hypothesis is correct.

I found that among blacks, the correlation between g scores and skin color (darkness) was -0.133 (N=1856), whereas T scores were unrelated to skin color (r=-0.012, ns; N=1856). Among Hispanics, g scores correlated with skin darkness at -0.123 (N=1051), while T scores were unrelated to skin color (r=0.062, ns; N=1051). Therefore the results are about as expected. (See the previous post for information about the T factor.)

Applying again the method of correlated vectors (MCV), we found that vectors of skin color-test gap correlations were strongly and significantly associated with g loadings within populations. In other words, lighter-skinned individuals tended to outscore darker-skinned coracials/coethnics more on tests with higher g loadings. Among blacks, the correlations were r=-0.84 and rho=-0.75, and among Hispanics r=-0.60 and rho=-0.59 (correcting for unreliability would make all these correlations somewhat stronger).

The MCV results could be interpreted in terms of genetic effects: tests with higher g loadings are more heritable, and skin color is a proxy for white ancestry and thus presumably better “IQ genes”. But why would these within-population color analyses produce the expected correlations between g loadings and race markers (i.e., skin tone) when the between-population MCV analysis, presented in the previous post, did not? It appears that on the ASVAB g is the major source of racial/ethnic differences, but the T factor also contributes to the gaps. (Cohen’s d’s on the g scale were B-W 1.124, B-H 0.368, and H-W 0.759, while on the T scale they were B-W 0.561, B-H 0.261, and H-W 0.306.) However, T is not associated with skin color within populations, which suggests that its heritability is low and it is linked to race and ethnicity for non-genetic reasons. This would explain why the MCV results from within- and between-population analyses differ.

In the NLSY97, higher g is associated with lighter skin among blacks and Hispanics. This is in accord with hereditarian theory, but nurturists would of course argue that these correlations are due to colorism. These competing hypotheses could be tested by comparing skin color-IQ associations within and between families, as was done here.

Spearman's hypothesis and the NLSY97-ASVAB, part 1

According to Spearman’s hypothesis, black-white gaps on cognitive tests are larger on tests that are better measures of g, or general mental ability. If g is the only or main source of the black-white gap, it indicates that within- and between-race differences are qualitatively similar and that understanding the nature of the racial gap requires that we understand the nature of g.

One of the ways that the late Arthur Jensen used to test the hypothesis was the method of correlated vectors (MCV). It involves factor analyzing a battery of cognitive tests taken by a sample of individuals from different races, and correlating the resultant vector of g loadings with the magnitudes of racial differences on each subtest of the battery. The expectation is that tests with higher g loadings are associated with larger racial gaps. Jensen did a number of analyses of this kind, and found that the average correlation between g loadings and subtest differences across many different samples of blacks and whites was 0.63 (after correction for unreliability), supporting the notion that g is the main source of the black-white gap. Analyses of Hispanic-white gaps have also generally supported the idea that g is their major source.

John Fuerst and I studied Spearman’s hypothesis in the NLSY97 sample. The sample sizes in the NLSY97 are ~4400 for whites, ~2300 for blacks, and ~1800 for Hispanics, although they may be lower in specific analyses below. We mostly followed the procedures in Nyborg & Jensen 2000, although we used principal axis factoring rather than PCA. The NLSY97 participants took the ASVAB, which comprises the following tests:

General Science (GS)
Arithmetic Reasoning (AR)
Word Knowledge (WK)
Paragraph Comprehension (PC)
Numerical Operations (NO)
Coding Speed (CS)
Auto Information (AI)
Shop Information (SI)
Mathematics Knowledge (MK)
Mechanical Comprehension (MC)
Electronics Information (EI)
Assembling Objects (AO)

The ASVAB yielded a similar two-factor structure across the black, white, and Hispanic samples. The first factor, which we identified as g, explains about 60 percent of the variance in the ASVAB, while the second factor explains about 10 percent; the rest can be regarded as test-specific variance and measurement error. The second factor is not very easily interpretable, but I would tentatively consider it as representing technical knowledge because it has some of its highest loadings on the Auto and Shop Information tests, which have questions like this:

A fuel-injected engine does not need:

(A) spark plugs
(B) a fuel pump
(C) a carburetor
(D) an alternator

The ASVAB is the Armed Services Vocational Aptitude Battery, so it contains also items that would not show up in a typical IQ test. I’ll call the second factor the T factor.

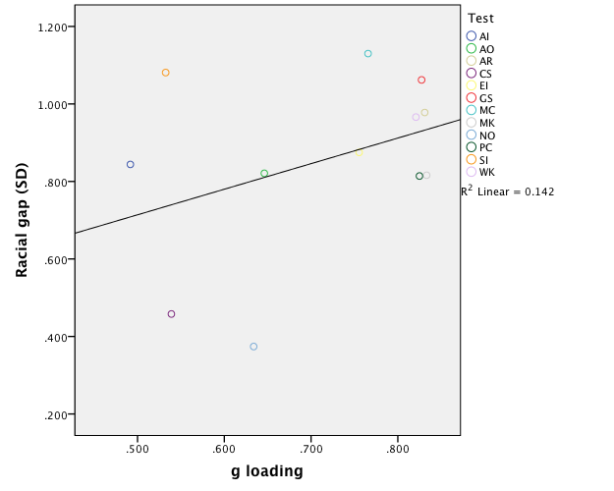
We correlated the averaged g loadings of each race/ethnicity pair with the magnitudes of white-black, black-Hispanic, and white-Hispanic gaps on each ASVAB test. All the Pearson’s r and Spearman’s rho analyses showed small to moderate positive correlations, none of which were statistically significant at conventional levels (significance testing is based on Spearman’s rho in these analyses, see Nyborg & Jensen 2000 for details). For example, here’s the scatter plot from the black-white analysis:
Image

Pearson’s r’s for white-black, black-Hispanic, and Hispanic-white comparisons were 0.38, 0.12, and 0.39, respectively, while the corresponding Spearman correlations were 0.14 (ns), 0.077 (ns), and 0.287 (ns).

However, it could be that the expected correlations aren’t there because of confounding due to different reliabilities of the tests. However, controlling for reliabilities doesn’t substantially change the results (not shown here).

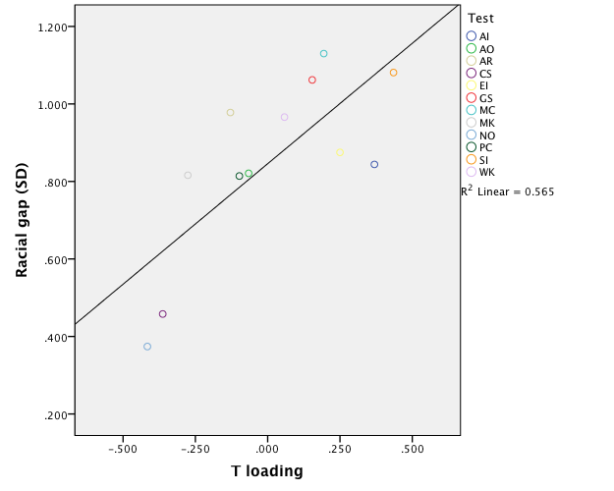
Therefore, the MCV does not support the hypothesis that g is driving the racial/ethnic differences in the ASVAB tests. So what then explains the fact that gaps differ across tests? I correlated the loadings of the second factor, the T factor, with differences in test means between whites, blacks, and Hispanics. Surprisingly, the T factor is strongly (r=0.75, rho=0.72) and highly significantly (p<0.01) correlated with the magnitudes of the gaps in the black-white analysis. The results hold even when partialling out reliabilities. The scatter plot looks like this:
Image

In the black-Hispanic and Hispanic-white analyses the results are broadly similar, although the correlations are somewhat smaller and not always significant. Thus the racial/ethnic gaps are not only not explained by differences in g loadings, but are in fact explained by loadings on the T factor which is uncorrelated with g! Does this mean that T and not g is the main source of racial/ethnic differences in ASVAB abilities? In fact, it does not indicate that, and these analyses only demonstrate the shortcomings of the MCV.

One way of studying how different factors contribute to differences between the mean scores of races/ethnicities is to do a point biserial correlation between each racial/ethnic dichotomy and scores on each test and partial out factor scores on either factor. Here’s the results from the black-white analysis (all the results below are significantly different from zero unless otherwise indicated):

Zero-order g partialled out T partialled out
GS 0.358 0.052 0.337
AR 0.339 .003 ns 0.377
WK 0.321 .002 ns 0.322
PC 0.284 -0.083 0.317
NO 0.130 -0.143 0.261
CS 0.170 -0.060 0.275
AI 0.295 0.111 0.217
SI 0.368 0.188 0.317
MK 0.279 -0.067 0.357
MC 0.378 0.111 0.350
EI 0.289 -.006 ns 0.249
AO 0.297 0.034 0.315

As can be seen, partialling out g scores removes most of the gaps in all tests, while partialling out T scores has only a small effect. Thus g is the main source of cognitive differences between blacks and whites, while T is a minor source. For some reason, T is nevertheless a major source of differences between the relative sizes of gaps on different tests, which is why the MCV analysis fails.

The results from Hispanic-white analyses are rather similar:

Zero-order g partialled out T partialled out
GS 0.262 0.068 0.238
AR 0.198 -0.054 0.212
WK 0.236 0.036 0.222
PC 0.179 -0.069 0.188
NO 0.139 -0.020 0.207
CS 0.105 -0.045 0.162
AI 0.19 0.068 0.148
SI 0.248 0.106 0.206
MK 0.175 -0.056 0.214
MC 0.211 -0.002 ns 0.181
EI 0.216 0.026 0.179
AO 0.097 -0.101 0.114

Finally, black-Hispanic differences:

Zero-order g partialled out T partialled out
GS 0.102 -0.012 0.122
AR 0.167 0.081 0.224
WK 0.09 -0.032 0.121
PC 0.12 -0.004 ns 0.163
NO -0.028 -0.162 0.075
CS 0.072 -0.027 0.147
AI 0.127 0.060 0.105
SI 0.14 0.117 0.159
MK 0.117 -0.018 0.189
MC 0.208 0.168 0.229
EI 0.073 -0.024 0.100
AO 0.256 0.192 0.272

Overall, these results support the hypothesis that g is the major source of racial/ethnic differences in the ASVAB, particularly between whites and blacks. The analysis also shows that the MCV is a flawed method, which is of course well known. For example, according to Ashton and Lee 2005, “first, associations of a variable with non-g sources of variance can produce a vector correlation of zero even when the variable is strongly associated with g; second, the g-loadings of subtests are highly sensitive to the nature of the other subtests in a battery, and a biased sample of subtests can cause a spurious correlation between the vectors.”

Multi-group confirmatory factor analysis appears to be a much better method for testing Spearman’s hypothesis. At the moment, that method is unfortunately beyond my skills and patience.

In part 2 of this post I’m going to extend this analysis to differences in skin color.

See here for John’s SPSS syntax for combining the ASVAB variables (there are two of them for each test), regressing out the effect of age on ASVAB scores, and performing a factor analysis on the ASVAB.

The Limits of Selectivity

Figure 1 below shows the last five years of SAT scores for African Americans who were a part of the Department of Defense educational system (DoDEA) and for those who were not (Nation). The former, the children of enlisted personal, perform almost 0.3 standardized units better than the latter. Elsewhere, I have documented that this 0.3 difference can be found in DoD schools both in the US and abroad.

Figure1.  SAT

An obvious explanation for the DoDEA/ Nation difference is parental selectivity. Entrance into the military is mostly limited to those with AFQT z-scores above -1 relative to a US national mean of 0. As the Black cognitive ability mean is about -1, on the same scale, only the upper half of the Black population is qualified for entrance into the military; as a result, Africa American recruits represent, on average, the 75th percentile of the Black cognitive ability distribution. As such, those selected should be about 0.67 SD (standardized units) above the African-American mean. Given the coefficient of assortative mating typically reported in the literature of 0.33, and assuming a trivial number of Military-Military parings, a random pair of African Americans, for which one individual is or was a member of the military, should have a mid parent IQ 0.45 SD above that of a random pair for which neither individual is or was a member of the military. Multiplying by the typically found coefficient of regression of 0.6 gives one a military, non-military offspring difference of about 0.27 – and this would account for the DoDEA/Nation difference in full. In theory. Continue reading

« Older posts Newer posts »

© 2026 Human Varieties

Theme by Anders NorenUp ↑