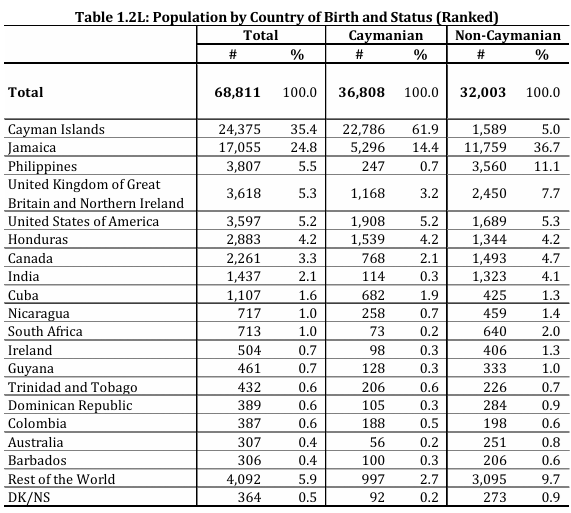
The Cayman Islands, a British Overseas Territory, boasts one of the world’s highest standards of living and per capita GDP, largely due to its status as a major tax haven. Its average Human Development Index (HDI) from 2010, 2015, and 2020 was 0.876 (Economic and Statistics Office, 2021), compared to the United Kingdom’s 0.919 over the same period—both rated as very high human development. The 2021 census recorded a population of 68,811, with 53% identified as Caymanian residents, of whom only 62% were born on the island. These demographic shifts, detailed in Figure 1, complicate efforts to estimate ancestry proportions.
Figure 1. Population by Country of Birth for the Cayman Islands (2021)
The Cayman Islands government does not officially report race or ethnicity data, contrary to Wikipedia’s assertions. The 2008 CIA World Factbook estimates the racial composition as 40% Afro-European, 20% African, 20% European, and 20% “other,” but the basis for these figures is unclear, and their frequent citation lacks specificity.
Genetic ancestry data specific to the Cayman Islands is scarce. The only relevant study, Micheletti et al. (2020), analyzed 23andMe samples from 1,526 self-identified Black individuals from Jamaica and the Cayman Islands (not disaggregated). Participants were included if all four grandparents were born in the same country and reported historical ties to an African nation. The study found an average ancestry (corrected so to be out of 100%) of 78.89% African, 19.84% European, and 1.23% East Asian and Amerindian combined. Given Jamaica’s population (2.8 million) vastly exceeds the Cayman Islands’, most samples likely represent Jamaicans, limiting the study’s applicability to Caymanians.
To estimate Caymanian resident ancestry, we rely on several assumptions:
- Non-immigrant Caymanian residents (61.9% of the resident population) align with the CIA’s 2008 breakdown: 50% Afro-European, and 25% African, and 25% European.
- Black non-immigrant Caymanians born on the island have an ancestry profile similar to Jamaicans. Jamaican ancestry, based on four studies including Micheletti et al. (2020), is shown in Table 1. Except for Vergara et al. (2013), these studies focus on self-identified individuals of African descent. The 2011 Jamaican census shows 98.17% of Jamaicans identify as Black (92.11%) or mixed (6.06%), suggesting no need to adjust for non-Afro-descent groups (unlike Barbados or the Bahamas).
Table 1: Admixture estimates for Jamaica
| Ethnic group | N | Markers | European % | African % | Amerindian % | East Asian % | Source |
|---|---|---|---|---|---|---|---|
| Afro-Caribbean | 119 | 15 STRs | 16 | 78.3 | 5.7 | Simms et al. (2010) | |
| Afro-Caribbean | 44 | 105 AIMs | 10.3 | 81.4 | 8.3 | Torres et al. (2013) | |
| General population | 706 | 237 AIMS | 14.00 | 76.00 | 9 | Vergara et al. (2013) | |
| Self-reported African ancestry | 45 | 551,510 SNPs | 11 | 89 | 1 | Mathias et al. (2016) | |
| Self-reported African ancestry | 1526 | 560,000 SNPs | 18.99 | 75.5 | 0.17 | 1.01 | Micheletti et al. (2020) |
| above corrected | 19.84 | 78.89 | 0.18 | 1.06 | Micheletti et al. (2020) | ||
| Average | 14.23 | 80.72 | 1.90 | 3.15 |
- White non-immigrant Caymanians resemble white British individuals (~100% European).
- Self-identified mixed-race non-immigrant Caymanians reflect an intermediate blend of African and European ancestry.
- Immigrants (38.1% of the resident population), mirror their countries’ average ancestry.
Weighting these groups by population share and ancestry profiles yields an approximate Cayman Islands average of 50% European, 40% African, 5% Amerindian, and 5% other (e.g., East Asian, South Asian). Without Cayman-specific genetic studies or detailed demographic data, this remains a rough estimate.
Turning to academic achievement, prior estimates suggested a CXC ACHQ of 85.41 and a GMATQ of 94.45 relative to the U.S. mean, averaging 89.48. However, these rely on selective samples (test-takers), limiting their representativeness.
Additional data from 2019-20, 2020-21, 2021-22, 2023-24 educational reports offer CAT4 scores for 1,543 Year 11 students in government schools, where most Cayman residents study (expatriates often attend private schools). These scores, (apparently) benchmarked against UK norms, yield a weighted mean of 92.88. This is much higher than the HVIQ of 74 estimated by Jason Malloy based on data from the middle of last century!
In this series, our focus is on ACHQ. For the academic years 2021-22 and 2023-24, the Department of Education has provided the Rising Stars assessment results for Year 6 students. Rising Stars is a UK-based assessment that aligns with the UK mean. Instead of reporting mean scores or percentages of students achieving basic levels, only the percentage of students performing at the level predicted by CAT4 is provided. However, with the application of clever statistical methods, it is possible to estimate the mean scores.
To illustrate, Figure 2 displays the 2023-24 attainment across Grammar, Punctuation, and Spelling (GAPS), Reading, and Mathematics relative to the predictions from the CAT4 test. To estimate the Academic Achievement Quotient (ACHQ), we consider 100% meeting expectations as equivalent to performing at the CAT4 mean. We express this relative to a normal curve by dividing the percentage meeting expectations by 2. For instance, in 2023, 81% met the GAPS predictions; halving this value (0.81/2 = 0.405) places it relative to a mean of 0.50 on a normal curve. Applying a normal curve transformation results in a difference of 0.24 (NORMSINV(0.50) – NORMSINV(0.405)) relative to the CAT mean. Averaging this difference across subjects and years gives a Cohen’s d of 0.37. With a CAT4 mean of 94.84 for the two years with Rising Stars data (UK-normed), we adjust by subtracting 0.37 *15 from the mean CAT4 for these years, resulting in 89.29. Since the UK ACHQ mean is 0.43 points above the U.S. mean, we add this difference to arrive at 89.72 (USA-normed).
Figure 2. Relative Performance on Rising Star versus CAT4 Assessments, 2023-24

Note: Figure from the 2023-24 government report showing Year 6 attainment in government schools, based on end-of-year school-based tests. Performance is measured as the percentage of students meeting CAT4-predicted levels (CAT4 Predictor), Rising Stars (RS), and Key Stage 2 SATs (KS2 SATS) across GAPS, Reading, Writing, and Mathematics.
This result aligns closely with our earlier estimate of 89.48, based on the average of CXC and GMAT scores. Thus, estimates derived from three different tests—normed against Caribbean, U.S., and UK populations—converge. We adopt an ACHQ of 89.37 as the current best estimate for the Cayman Islands. This is lower than the NIQ of 92.88 (for 2021 to 2023), which is consistent with governmental reports noting a discrepancy between these metrics. For example, in 2023 it is noted:
When the KS2 data is compared against both CAT4 predictors and Rising Stars estimates for this cohort, a consistent pattern emerged: students consistently lag behind their predicted or estimated levels across all areas. The striking aspect is the substantial variances mathematics: 56pp and 33pp for CAT4 and RS, respectively (See Figure 12). This underperformance may stem from gaps in foundational knowledge, insufficient practice opportunities, or potential misalignment between instructional approaches and the skills measured by these assessments.
We consider both NIQ and NACHQ to measure “national cognitive ability,” so one might average the two for a combined estimate. However, for consistency in this series, we rely on ACHQ.
In the context of the Admixture in Americans project, results from the Cayman Islands are of limited value due to uncertainties in ancestry and cognitive ability estimates, and, more significantly, the high proportion of recent immigrants, who cannot be assumed to represent their home populations.
References
Economic and Statistics Office. (2021). The Cayman Islands’ Human Development Index report 2021. Economic and Statistics Office.
Department of Education Services, Cayman Islands Government [DES]. (2021–2024). Data reports for academic years 2020–21 to 2023–24. Cayman Islands Government.
Mathias, R. A., Taub, M. A., Gignoux, C. R., Fu, W., Musharoff, S., O’Connor, T. D., … & Barnes, K. C. (2016). A continuum of admixture in the Western Hemisphere revealed by the African Diaspora genome. Nature communications, 7(1), 12522.
Micheletti, S. J., Bryc, K., Esselmann, S. G. A., Freyman, W. A., Moreno, M. E., Poznik, G. D., … & Mountain, J. L. (2020). Genetic consequences of the transatlantic slave trade in the Americas. The American Journal of Human Genetics, 107(2), 265-277.
Simms, T. M., Rodriguez, C. E., Rodriguez, R., & Herrera, R. J. (2010). The genetic structure of populations from Haiti and Jamaica reflect divergent demographic histories. American Journal of Physical Anthropology: The Official Publication of the American Association of Physical Anthropologists, 142(1), 49-66.
Torres, J. B., Stone, A. C., & Kittles, R. (2013). An anthropological genetic perspective on Creolization in the Anglophone Caribbean. American journal of physical anthropology, 151(1), 135-143.
Vergara, C., Murray, T., Rafaels, N., Lewis, R., Campbell, M., Foster, C., … & Barnes, K. C. (2013). African ancestry is a risk factor for asthma and high total IgE levels in African admixed populations. Genetic epidemiology, 37(4), 393-401.
Discover more from Human Varieties
Subscribe to get the latest posts sent to your email.

Leave a Reply