According to Matthews, Tabery, & Turkheimer (2025), our Admixture in the Americas project is “abhorrent” because nothing good could come from investigating “alarming hypotheses regarding the genomic basis of differences in cognitive abilities between racial and ethnic groups.” While Eric Turkheimer’s position is predictable given his well-known motivations, it is surprising to see philosophers like James Tabery also resorting to sloppy, moralistic reasoning. Notably, in the two Admixture in the Americas papers cited by Matthews et al. (2024), we explicitly stated that our research does not test a genetic model. Instead, drawing on Putterman and Weil’s Post-1500 Population Flows and the Long-Run Determinants of Economic Growth and Inequality and a large body of “deep roots” economic literature, we examined a genealogical model, recognizing that various factors could explain the intergenerational transmission of differences. In The Genealogy of Differences (2016), responding to a critique from Ibarra (2016), we elaborated:
According to [our model], intergenerationally transmitted factors such as genes, epigenes and culture code for individual-level traits related to individuals’ ability to acquire knowledge and to develop better societies (e.g., a cultural appreciation of education and learning affecting the development of cognitive abilities). By this model, BGA acts as a crude index of the lines of descent along which the individual-level traits, the true causal factors, are passed… to deny a priori the possibility of our model, Ibarra equates an intergenerational model with a behavioral genetic one and then, incredibly, adopts a Blank Slate position. This is, of course, a doubly absurd argument. First, we stipulated that our model was an intergenerational, or genealogical, transmission, and not necessarily a behavioral genetic one. We made that point in three separate sections of the [original] paper.
This argument was not purely theoretical. We emphasized our skepticism of a simplistic genetic model by pointing to the exceptional performance of certain Caribbean nations, such as Barbados, which we discussed further:
It is notable that these estimates for Barbados are themselves high given that the country is about 90% West African in ancestry, a percent which leads to predicted national achievement/IQ scores in the low 70s. This is not a problem for our model, per se, since we assume a sticky but non-deterministic relation between BGA and national cognitive abilities. The relation can be so since national scores are not psychometrically equivalent to individual scores (e.g., Täht and Must, 2013). The latter primarily index hereditary general intelligence (at least in developed countries within a given cultural group) and therefore are relatively immalleable; the national level or “Big G” (Rindermann, 2007) scores, on the other hand, are subject to population level amplifiers and depressants that, we presume, work through the educational system and other social institutions.
We went on to explain:
The important question that more reliable Caribbean scores, in addition to more information on the performance of SIRE/BGA groups within nations, can help answer is whether the association between BGA and CA is more of a historic contingency, one that we can not comfortably extrapolate into the future, as would be the case with a purely cultural model, or if it is sticky, albeit elastic, owing to factors more firmly grounded in genealogical lines (e.g., genes or epigenes)
Interestingly, our model is not inconsistent with the anti-racist framework proposed by Lala and Feldman (2024), who argue that differences arise from vertical cultural transmission, enabling disparities to “persist through the legacies of inherited norms and institutions, inherited wealth and power, inherited values and traditions, and inherited environments that vary in their amenities and opportunities.” Why, then, is our model—and the research based on it—labeled abhorrent, while models like Lala and Feldman’s (2024) are praised? The apparent reason is our open-minded approach, which refuses to dismiss a partial genetic hypothesis a priori on moral grounds. However, to philosophers of science like Tabery, not presuming that differences are environmental in origin marks our work as ‘bad-guy science’ rather than ‘good-guy science.'”
Fortunately, outside of academia, we enjoy the freedom to explore diverse theories about the origins of differences with an open mind. Regarding variations in national cognitive scores, our reasoning is as follows: If these differences are primarily environmental in origin, we would expect wealthier Caribbean nations—boosted by tourism or tax-haven economies—to achieve scores similar to those of European countries. Conversely, if differences are primarily hereditary, the scores of Caribbean countries with predominantly African ancestry should mirror those of African nations. It’s important to note, however, that national and regional-level scores are not directly comparable to individual-level scores due to systematic country-level effects. Despite this complication, the general pattern described is what one would typically expect. Among sovereign countries, cognitive achievement data is missing for Barbados and Bermuda. We will consider those countries here in detail.
. . .
Barbados is a small island nation in the Caribbean with a population of approximately 280,000 individuals. Historically, it was a British colony from 1625 until gaining independence in 1966. Its economy was initially driven by sugar production before diversifying into tourism and international business in the 20th century. Today, Barbados ranks 62nd out of 193 countries in the United Nations’ Human Development Index (HDI) as of 2022, with a score of 0.809, placing it in the “very high human development” category—reflecting strong achievements in life expectancy, education, and income per capita.
According to the 2010 census, 92.4% of the population identifies as Afro-Barbadian, while 3.1% identifies as mixed, 2.7% as White, 1.3% as East Indian, and 0.5% as other. At least five published studies have reported on the ancestry composition of Barbadians or Afro-Barbadians. These are summarized in Table 1 below and they indicate that Afro-Barbadians are approximately 85% African and 13% European in ancestry. Treating White Barbadians as fully European and while treating self-reported mixed Barbadians as intermediate between Afro and White Barbadian, we estimate the population as a whole to be about 80% African and 17% European in ancestry. This aligns with the ancestry composition of the British Windward Islands.
Table 1: Admixture estimates for the Barbados
| Author | Ethnicity | N | Weight | % Afr | % Eur | % Amer | % Other |
|---|---|---|---|---|---|---|---|
| Benn-Torres et al. (2007) | Afro-Carib | 95 | 1 | 89.60 | 10.20 | 0.20 | 0.00 |
| Murray et al. (2010) | Afro-Carib | 294 | 1 | 77.40 | 15.90 | 6.70 | |
| Montinaro et al. (2015) | Afro-Carib | 75 | 1 | 87.70 | 11.70 | 0.00 | 0.60 |
| Mathias et al. (2016) | NR | 39 | 1 | 84.00 | 16.00 | 0.00 | 0.00 |
| Martin et al. (2017) | Afro-Carib | 96 | 1 | 88.00 | 11.70 | 0.30 | 0.00 |
| Afro-Barbadian | 85.34 | 13.1 | 0.125 | 1.46 | |||
| All Barbados | 80.05 | 16.60 | 0.10 | 3.25 |
African countries typically score about two standard deviations, or 30 points, lower than predominantly White European countries on academic achievement tests. Considering this disparity and factoring in ancestry, we can estimate that Barbados would score around 76 in comparison to these European countries (given a simple vertical transmission model). However, when adjusting to a scale normed to the USA—where White Americans score about 4 points higher on similar tests—the expected score for Barbados adjusts to approximately 80.
Our data, although limited, indicate a significantly higher capability for Barbadians. Between 2000 and 2020, 619 individuals from Barbados who took the GMAT achieved an average score of 94 compared to the US mean and 92.2 relative to the US White GMAT mean.
Additionally, Becker’s data suggests a measured IQ of 95.75 relative to the US mean. However, Becker’s analysis contains significant flaws, primarily due to the use of overlapping samples, which resulted in double counting. I contributed to this error by providing unclear data. The latest data include samples from the Barbados Nutrition Study (Waber et al., 2014) and their offspring (Waber et al., 2018). These studies followed a cohort born in Barbados from 1967 to 1972, assessing both a malnourished groups (suffering from Marasmus or Kwashiorkor) and a control group, along with the children of both groups. Based on the control group and their children, we estimate a national IQ of 90.83 relative to the American mean. These results are detailed in Table 2 and were calculated using Becker’s Flynn effect correction (FEC) calculator. Notably, while there might be a case for including children of the malnourished group, given the unlikely intergenerational transmission of malnutrition effects, we use only data from the control group and their children.
Table 2: Summary of IQ Data for Samples from Barbados, With and Without Flynn Effect Corrections
| WASI | WRAT-III | WAIS-III DS & LN | |||||||
|---|---|---|---|---|---|---|---|---|---|
| Age | N | Reported M | FEC M | Reported M | FEC M | Reported M | FEC M | Average | |
| Control | 38.13 | 59 | 99.03 | 96.65 | 88.96 | 84.54 | 92.35 | 88.95 | 90.05 |
| Malnutritioned | 38.36 | 77 | 82.83 | 80.45 | 74.59 | 70.17 | 82.35 | 78.95 | 76.52 |
| Children of control | 19.7 | 50 | 99.10 | 96.72 | 91.20 | 86.78 | 91.75 | ||
| Children of malnutritioned | 19.3 | 64 | 89.60 | 87.22 | 86.27 | 81.85 | 84.53 |
Unfortunately, the PIRLS data for Barbados was never published. However, it is feasible to estimate achievement scores based on relative performance in the Caribbean Examinations Council (CXC) exams. Established in 1972, the CXC administers standardized tests for secondary school students across the Caribbean, offering qualifications like the Caribbean Secondary Education Certificate (CSEC) typically taken around ages 16 to 18. These exams cover a wide array of subjects, from mathematics and English to sciences, humanities, and vocational areas, assessing students’ academic and technical skills. Internationally recognized, CXC exams are key to higher education and employment, aligning with the region’s educational standards.
Frequently cited by the World Bank as indicators of educational achievement, the CXC consortium and local ministries report regional and country-specific pass rates, respectively. These pass rate differences can be transformed into deviation scores relative to the Caribbean average. With both international achievement and CXC scores available for many countries, it is possible to compute a national CXC quotient (CXCQ) in a manner similar to Harmonized test scores. Deviation scores were calculated annually relative to the regional average for the years 2010 to 2024 (when available). Summary results are reported in Table 3, with more detailed data accessible via the provided link.
Table 3: Summary of CXC scores
| Altinok et al. ACHQ | MICS FLS | CXC_Math | CXC_English | CXC Ave | Predicted ACHQ | |
|---|---|---|---|---|---|---|
| Cayman Islands | -0.28 | -0.13 | -0.21 | 85.41 | ||
| Brittish Virgin Islands | -0.50 | -0.67 | -0.59 | 91.15 | ||
| Barbados | -0.38 | -0.38 | -0.38 | 87.99 | ||
| Turks & Caicos | 92.12 | 0.06 | -0.07 | 0.00 | 82.37 | |
| Montserratt | -0.22 | -0.17 | -0.19 | 85.24 | ||
| Anguilla | -0.04 | -0.32 | -0.18 | 84.99 | ||
| Trinidad/Tobago | 91.97 | 90.50 | ||||
| Jamacia | 81.30 | 85.29 | ||||
| Guyana | 75.19 | 92.51 | 0.18 | 0.20 | 0.19 | 79.47 |
| St. Kitts | 84.59 | |||||
| Dominica | 83.80 | |||||
| Belize | 71.93 | |||||
| St. Lucia | 85.89 | |||||
| St. Vincent | 81.94 | |||||
| Antigua and Barbuda | 84.28 | |||||
| Grenada | 82.44 | |||||
| Average | 82.33 | 89.43 | 0.00 | 0.00 | 0.00 |
Based on a decade of data, Barbados has achieved a CXC quotient score of 87.99. Averaging this with the GMAT scores yields a tentative academic achievement quotient (ACHQ) of 90.99, which closely aligns with the estimated IQ. This analysis also offers preliminary ACHQ estimates for the British territories of the British Virgin Islands (86.44), Montserrat (88.95), and Anguilla (84.99) — averaging CXC and GMAT results. These estimates are very preliminary and will need updates following the release of the MICS results for the British Virgin Islands and Anguilla.
. . .
The Bahamas, an archipelago in the Caribbean consisting of around 700 islands, has a population of approximately 400,000 according to 2025 estimates. It was under British control from 1718, primarily to combat piracy, until gaining independence in 1973. In 2022, the Bahamas ranked 57th in the Human Development Index with a score of 0.820, reflecting very high human development. The nation’s economy relies heavily on tourism and financial services, with tourism accounting for about 70% of GDP.
According to the 2010 census, approximately 90.6% of the Bahamian population identifies as African descent, 4.7% as White, 2.1% as mixed, and 1.9% as other. Several studies have examined the ancestry composition of admixed Bahamians, though it’s unclear if these include only self-identifying Afro-Bahamians. Summarized in Table 4, these studies show that admixed Bahamians are about 81.5% African and 15% European in ancestry. Assuming that self-identifying White and other Bahamians are unadmixed, the overall population is estimated to be roughly 75.5% African and 18.5% European in ancestry.
Table 4: Admixture estimates for the Bahamas
| Author | Ethnicity | N | Weight | % Afr | % Eur | % Amer | % Other | |
|---|---|---|---|---|---|---|---|---|
| Micheletti et al. (2020) | >5% Afr | 65 | 1 | 79.3 | 19.5 | 0.6 | 0.6 | |
| Godinho (2008) | NR | 157 | 1 | 85.2 | 6.8 | 8 | ||
| Simms et al. (2012) | NR | L. Island | 87 | 5.45% | 65.40 | 26.90 | 0.00 | 7.70 |
| Simms et al. (2012) | NR | Abaco | 111 | 4.20% | 75.00 | 23.50 | 0.00 | 1.50 |
| Simms et al. (2012) | NR | N. Providence | 221 | 74.50% | 79.70 | 19.60 | 0.60 | 0.00 |
| Simms et al. (2012) | NR | Eleuthera | 112 | 2.32% | 80.30 | 13.70 | 6.00 | 0.00 |
| Simms et al. (2012) | NR | G. Bahamas | 133 | 11.70% | 86.70 | 8.80 | 3.90 | 0.50 |
| Simms et al. (2012) | NR | Exuma | 92 | 1.83% | 90.40 | 3.70 | 5.90 | 0.00 |
| w-average | 535 | 1 | 79.75 | 18.47 | 1.15 | 0.54 | ||
| Admixed BHS | 81.42 | 14.92 | 3.25 | 0.57 | ||||
| All BHS | 75.47 | 18.53 | 3.25 | 2.47 | ||||
Regarding cognitive data, between 2000 and 2020, 619 Bahamians who took the GMAT scored an average of 83.35 relative to the US mean and 81.55 relative to the US White GMAT mean. Jason Malloy summarized two IQ studies involving a total of 723 individuals, from which Becker derived a national IQ of 91.01. However, the most recent study is now over 25 years old.
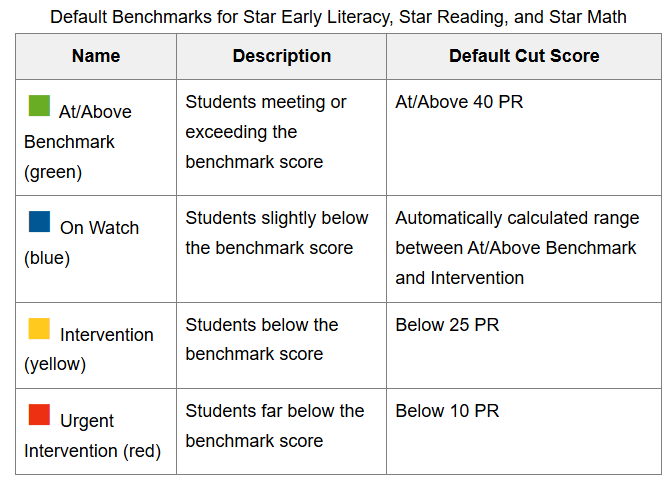
If we are willing to accept a few reasonable assumptions, there is another data source available. To evaluate learning loss post-Covid, the Bahamas government contracted with Renaissance Learning Inc., a US-based company, to administer Star reading and math assessments. Details about this assessment can be found in Wyse et al. (2020). Approximately 30,000 students participated in the first round of testing in 2022. The Minister of Education reported that, on average, 44% of students required “urgent intervention” (ZNS Bahamas, 2023). These Star assessments are normed against US populations, and the “urgent intervention” benchmark corresponds to scoring below the 10th percentile rank.
The 10th percentile corresponds to a Z-score of -1.281 or an IQ equivalent of 80.77. Given that 44% of students scored below this threshold, the estimated mean IQ-metric scores would be 83.04, relative to a US mean of 100. Assessments were normed in 2017, while testing occurred in 2022/2023. There was probably Covid-related learning loss owing to school closures. Based on NAEP data, between 2017 and 2022, White Americans lost 3.05 IQ-metric points. When adjusted for the Bahamas’ score, it results in a mean of 86.09 – similar to the GMAT-based estimate of 83.35. We tentatively take 86.09 as the estimated national achievement score. (Note: The underlying data can be accessed through Freedom of Information Act requests for Native Bahamians. If we find someone to submit a request, we could refine our estimates using the means and standard deviations.)
Bahamians also participated in the 2014 LAPOP survey, which included four political knowledge questions:
• The name of the US President
• The continent on which Nigeria is located
• The length of term for the President, Prime Minister, or Government
• The size of the Lower House
Political knowledge sum scores were computed by self-reported race/ethnicity and interviewer-rated color. These scores, transformed into an IQ metric with a mean of 100, along with the average years of education for each group, are presented in Table 5 below.
Table 5: Distribution of Political Knowledge and Education Levels by Self-Identified Race/Ethnicity in the Bahamas (LAPOP 2014)
| Ethnicity | N | Political knowledge | Years of schooling |
|---|---|---|---|
| White | 92 | 106.57 | 13.04 |
| Indigenous | 11 | 96.95 | 12.64 |
| Black | 3151 | 99.53 | 11.84 |
| Mixed | 153 | 105.65 | 12.79 |
| Other | 13 | 103.98 | 12.32 |
Knowledge sum scores were found to correlate negatively with darker color among Bahamians. The specific correlations for different groups are as follows:
• All Bahamians: r = -0.187 (N = 3404)
• Black Bahamians: r = -0.155 (N = 3128)
• Mixed Bahamians: r = -0.192 (N = 149)
Adjusting for age and sex did not significantly alter these correlations. Additionally, the results were consistent with those observed for years of education, indicating a robust pattern. These findings suggest potential ethnic, color, and ancestry differences in cognitive scores among Bahamians, which may merit further exploration.
References
Fuerst, J., & Kirkegaard, E. O. (2016). The genealogy of differences in the Americas. Mankind Quarterly, 56(3), 425.
Ibarra, L. (2016). Statistics vs scientific explanation. Mankind Quarterly, 56(3).
Lala, K. N., & Feldman, M. W. (2024). Genes, culture, and scientific racism. Proceedings of the National Academy of Sciences, 121(48), e2322874121.
Matthews, L. J., Tabery, J., & Turkheimer, E. (2024). How to diagnose abhorrent science. Hastings Center Report, 54(6), 18-29.
Putterman, L., & Weil, D. N. (2010). Post-1500 population flows and the long-run determinants of economic growth and inequality. The Quarterly journal of economics, 125(4), 1627-1682.
Waber, D. P., Bryce, C. P., Girard, J. M., Zichlin, M., Fitzmaurice, G. M., & Galler, J. R. (2014). Impaired IQ and academic skills in adults who experienced moderate to severe infantile malnutrition: a 40-year study. Nutritional neuroscience, 17(2), 58-64.
Waber, D. P., Bryce, C. P., Girard, J. M., Fischer, L. K., Fitzmaurice, G. M., & Galler, J. R. (2018). Parental history of moderate to severe infantile malnutrition is associated with cognitive deficits in their adult offspring. Nutritional Neuroscience, 21(3), 195-201.
Wyse, A. E., Stickney, E. M., Butz, D., Beckler, A., & Close, C. N. (2020). The potential impact of COVID‐19 on student learning and how schools can respond. Educational Measurement: Issues and Practice, 39(3), 60-64.
ZNS Bahamas (2023, June 16). 2023-24 Budget Debate: Learning Loss. ZNS Bahamas News. https://znsbahamas.com/2023-24-budget-debate-learning-loss/
Discover more from Human Varieties
Subscribe to get the latest posts sent to your email.

The national IQ of Barbados is surprisingly high. I’m curious what we should infer from this example. Do you think that this implies that populations with African ancestry could reach similar IQ levels under comparable conditions, or is there something unusual about the population of Barbados?
There are other similarly high scoring predominantly African countries/territories. Wait until I finish up the series of posts and then we can re-evaluation.