Category: HV Global IQ (Page 1 of 2)

Racial Ancestry in the Americas. Part 2: Cognitive Variation between Nations: Parasite Load, Climate, and Ancestry

Following up with a previous analysis, I examined the cognitive variation across the whole of the Americas using a newly constructed data set.  Files can be found here and here, with the latest versions provided on request.  The analysis was restricted to sovereign nations, not e.g., departments such as Martinique or territories such as the Virgin Islands.  Non-sovereign regions were excluded so to avoid an inter-nation x intra-national interaction and because international exam data was not available for these regions.  The following 35 countries were included:  Argentina, Antigua and Barbuda, Bahamas The, Belize, Bolivia, Brazil, Barbados, Chile, Colombia, Costa Rica, Cuba, Dominica, Dominican Republic, Ecuador, Guyana, Grenada, Honduras, Haiti, Jamaica, St. Kitts and Nevis, St. Lucia, Mexico, Nicaragua, Panama, Peru, Paraguay, El Salvador, Suriname, Trinidad and Tobago, Uruguay, United States, St. Vincent, Venezuela RB, and Canada. Eight regression analyses were run, using the following dependent variables:

  • (Skinrefl) Skin reflectance.
  • (AchQ) National Achievement Scores –  this was an updated set provided by Gerhard Meisenberg during October of 2014.
  • (NIQ) National IQ scores – these were based on Richard Lynn’s 2014 (work in progress) results and Jason Malloy’s 2013 to 2014 estimates, with adjustments.
  • (AHQ) 1880 to 1930 birth cohort age heaping scores — this is a measure of education/numeracy.
  • (logSciresearch) Log of scientific researchers from 2005 to 2012.
  • (logGDP) Average of 1990, 2000, and 2010 log of World Bank per capita GDP.
  • (Crimes) Violent Crime rates.
  • (HDI2012) 2012 Human Development Index scores.

The following independents were included:

  • (relativeEu) European Ancestry percent — the percent of European ancestry out of the percent of  European + Amerindian + African ancestry.  (For a discussion of this variable, refer here.)
  • (notUSCanada) Not US or Canada — whether the region was not US or Canada.
  • (logparasiteload) Log Parasite load — the log of the 2004 WHO parasite infections per 100,000 for each country.
  • (logColddemand) Log Cold demand — the log of Van de Vliert’s (2013) cold stress scores.
  • (PopUnder1million)  Population under 1 million — whether the country’s population was under one million.

Simple correlation analysis demonstrated that ancestry, cold weather, and parasite load intercorrelated.  This situation renders difficult the isolation of causal associations.  To illustrate, skin reflectance was set as a dependent with Eu ancestry, cold weather,  parasite load, population under 1 million, and not US and Canada as independents.  The correlation between Eu ancestry and skin reflectance is clearly mostly genetic in origin.  To the extent that the association between ancestry and skin reflectance is mediated by other variables, it is suggested that these variables co-vary with causal effects related to genes (and thus that controlling for them controls for ancestry related causal effects).  Regression results are shown in Table 1, below.  Generally, parasite load and cold weather seem to partially index ancestry effects.  Parasite load is a particularly problematic “environmental factor” because it significantly correlates with STD and HIV rates (at 0.47).  Yet the spread of HIV throughout the Americas, in the ’70s and ’80s, was subsequent to the origin of cognitive ability differences, which, in the form of national age heaping rates, were already present in the 1800s.  Thus, STD and HIV rates and with them parasite load are, to some extent, consequent of cognitive ability differences.

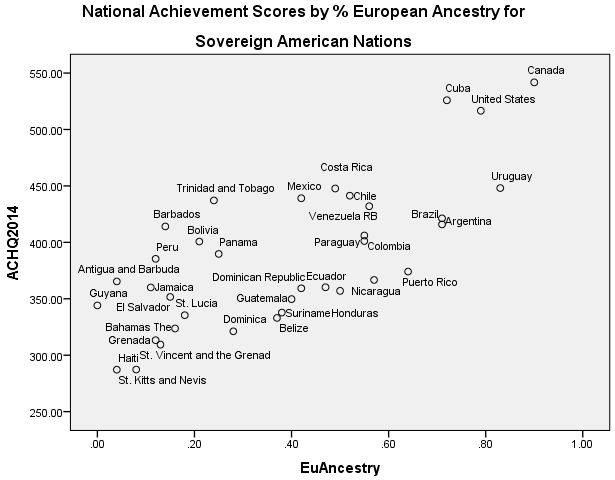
Results will not be discussed in detail.  The data file is made freely available; readers can run the analyses as desired.   Generally, European ancestry was a robust predictor of lower rates of violent crime, scientific activity, and achievement scores, and achievement plus National IQ scores.  (For national IQ alone, in the final model, none of the predictors were significant; this was because the NIQ sample had many missing values.)   In contrast to cognitive ability and the other mentioned indexes, European ancestry was generally not significantly associated with GDP or Human developmental indexes.  The results for National achievement scores are shown in Table 2, below; a regression plot is shown in figure 1.

Table 1.  Regression Results for Skin reflectance

reg1skinrefl

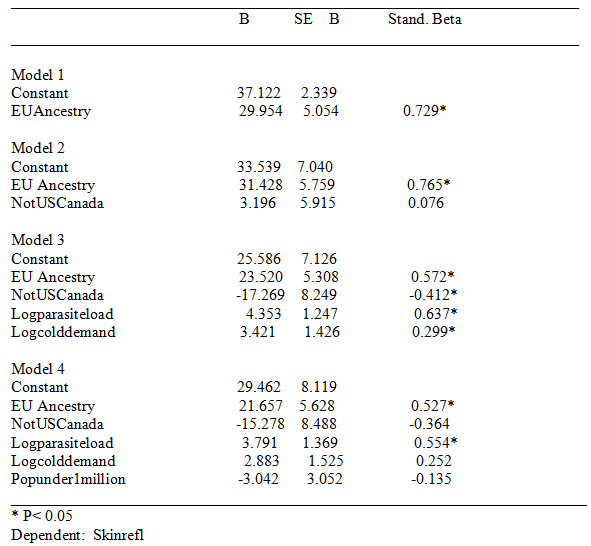
Table 2.  Regression Results for ACHQ2014

ACH2014

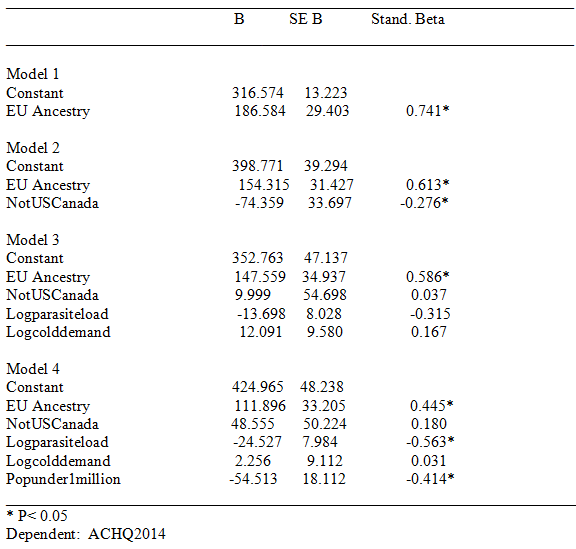
Figure 1.  National Achievement Scores by % European Ancestry for Sovereign American Nations

ACH2014AncestryAmer

HVGIQ: Laos

Laos is the least populated country in Indochina; home to nearly 7 million people. It is a single-party Marxist state, and ranks close to Cambodia and Burma on the tail end of human development indices. Ethnic Lao are about 55% of the population and inhabit the lowland regions. Numerous ethnic minorities inhabit more elevated regions, including the Hmong, who are about 8% of the population.

In this post I review one small study with intelligence test data for the nation of Laos. I also summarize over a dozen studies with intelligence and achievement test scores for Laotians living in the United States. A majority of these studies are for Hmong Americans.

Continue reading

HVGIQ: Thailand

Thailand has a population of over 64 million people, which is comparable to the United Kingdom or France. It is the world’s 21st most populous country.

IQ and the Wealth of Nations (2002) and IQ and Global Inequality (2006) both assign Thailand an IQ of 91 based on one clinical trial from 1989. Lynn and Vanhanen (2012, p. 417) add two more studies that push their estimate down to 88. Some of their numbers are reported inaccurately and these books overlook larger, higher quality, and more recent intelligence test studies for this nation. In particular—as I noted on Gene Expression almost a decade ago—the government of Thailand has implemented broad national IQ surveys, which have been reported in relation to U.S. and U.K. test norms.

In this post I review almost 50 studies of intelligence and scholastic achievement for the nation of Thailand. Many representative studies since the 1990s give conflicting results, making a solid estimate of Thailand’s IQ a difficult task.
Continue reading

HVGIQ: Vietnam

Richard Lynn and Tatu Vanhanen did not have a study for Vietnam in IQ and the Wealth of Nations (2002). Then, beginning with their follow-up book, IQ and Global Inequality (2006), Lynn added a bogus study for Vietnam and gave the world’s 13th most populous country a made-up national IQ of 94. In short, Lynn’s dataset does not have an IQ study for Vietnam.

In this post I review two dozen intelligence and achievement test studies for Vietnam and Vietnamese populations living internationally. While IQ in Vietnam is lower than I anticipated, there is evidence that Vietnamese people have high intellectual potential.

Continue reading

HVGIQ: Turks and Caicos Islands

The Turks and Caicos Islands is classified as a British Overseas Territory (other examples are Bermuda and the Cayman Islands). It has a population of 32,000, and its demographics are 88% black and 8% white. Like many small Caribbean territories, the Turks and Caicos Islands enjoy a high standard of living fueled by finance and tourism.

Lynn & Vanhanen do not have a study for this territory and, with the exception of Bermuda, they don’t include British Overseas Territories in their full dataset of estimated scores.

In this short post I summarize one study for the Turks and Caicos Islands.
Continue reading

HVGIQ: Cambodia

Much like Burma, Cambodia is a populous Southeast Asian country with a toxic authoritarian government, and routinely shows up at the back of human development indices. Richard Lynn’s international IQ dataset likewise does not yet have a study for this country.

Lynn & Vanhanen (2002, p. 74) make an IQ estimate of 89 for Cambodia by averaging together scores from its regional neighbors Thailand (91) and the Philippines (86). IQ and Global Inequality (2006, p. 56) revises this estimate to 91 by averaging together scores from three neighbors: Laos (89), Thailand (91), and Vietnam (94). Lynn & Vanhanen’s most recent update (2012, p. 21) assigns Cambodia an IQ of 92, but it’s not entirely clear why, as this book no longer lists the nations used to generate regional estimates. Presumably it’s the rounded average of Laos (89) and Vietnam (94).

In this post I present several different intelligence studies from Cambodia, as well some data for U.S. immigrants. These studies suggest that Cambodia has one of the lowest IQs in the world, but their achievement test scores in the U.S. exceed blacks and Hispanics.
Continue reading

HVGIQ: Burma

Burma, also known as Myanmar, has a population of over 60 million, and is the world’s 24th most populous nation. With an authoritarian, military-controlled government, it is also one of the poorest and most dysfunctional places on earth—you will find it nestled together with mostly African countries at the back of most human development rankings.

Richard Lynn’s international dataset does not yet have a study for Burma. IQ and the Wealth of Nations (2002, p. 74) makes an estimate of 86 by averaging together IQ from neighboring India (81) and Thailand (91). IQ and Global Inequality (2006, p. 59) bumps up India’s IQ to 82, which changes the Burma estimate to 87. The latest version of the dataset (Lynn & Vanhanen, 2012, p. 26) assigns a lower IQ to Thailand (88), which means that Lynn’s most recent estimate for Burma is 85.

I was able to locate one published intelligence study for Burma. The results are surprising, but the research contains no obvious flaws. Intellectual potential in Southeast Asia is an issue filled with contradiction and uncertainty.
Continue reading

HVGIQ: U.S. Virgin Islands

The American Virgin Islands are a territorial possession of the United States. According to the 2010 census, it has a population of 106,405 and an ethnic composition that is 76% black and 15.6% white. Almost all of the inhabitants live on three main islands: St. Croix, St. John, and St. Thomas. Virgin Islanders, much like Puerto Ricans, are United States citizens, but there has not been a similar push for U.S. statehood in this small territory.

Here I discuss several studies that have looked at the intelligence and academic skills of Virgin Islanders.
Continue reading

HVGIQ: Puerto Rico

The Commonwealth of Puerto Rico is a Spanish-speaking territory of the United States. Puerto Ricans are United States citizens—they can freely migrate between the island and the states, join the military, or even run for president. But they can’t vote for president, because the territory is not a U.S. state. In three referendums from 1967 to 1998, Puerto Rican voters rejected both political independence and U.S. statehood. However, in November 2012 a solid majority (61.3%) voted in favor of statehood. This kind of political nudging could quite possibly result in Puerto Rico becoming the 51st U.S. state … but only Congress and the president have authority over the matter, and analysts agree that approval is unlikely. This particular referendum also left off the option traditionally most favored by Puerto Ricans: continued commonwealth status. Many islanders appear to feel that statehood offers few additional benefits over citizenship; a majority of Puerto Ricans already live on the U.S. mainland (5 million vs. 3.7 million).

From the earliest days of intelligence testing, social scientists have taken a special interest in U.S. Hispanics. Proportionate to their numbers, it’s possible that more tests have been given to Hispanics than to blacks. But this special attention has also lacked focus. African-American test results have been subject to meticulous cataloging, synthesis and analysis (Shuey, 1966; Jensen, 1998; Jencks & Phillips, 1998) leading to somewhat of a consensus on the size and shape of the black-white cognitive performance gap. Yet there has not been a similar effort to process the disparate and voluminous literature on the abilities of U.S. Hispanics. Therefore there is less knowledge and consensus about the historical and contemporary test performance of Hispanic minorities.

Most of the U.S. Hispanic population is Mexican American (63%). Puerto Ricans are the second largest Hispanic minority (9.2% … or 15.3% including the Commonwealth). This post represents the first effort to comprehensively summarize the abilities of one of these two important American minority groups. Here I describe and analyze the results from over 70 studies that have measured the abilities of Puerto Ricans.

Continue reading

« Older posts

© 2024 Human Varieties

Theme by Anders NorenUp ↑