Emil and I set out to determine if regional variation in racial ancestry could (statistically) explain regional variation in cognitive ability. To keep things simple, we have limited focus to the Americas, which contain primarily trihybrid populations and for which there is a decent amount of admixture data. The results so far align with predictions. Both across nations and across regions within the U.S., Brazil, and Mexico, European ancestry positively correlates with regional-level cognitive ability. In contrast, both African and Amerindian ancestry negatively so correlates. The broader importance of the project is that it involves the construction of an expansive data set which allows for the statistical controlling of continental lineage and associated factors (genes + deep culture), ones which presently confound many analyses. This data set will hopefully allow one to uncover regional and national level factors which are not tangled with ancestry. They must exist. For example, we find that regional levels of European ancestry are associated with better outcomes in both the U.S. and Brazil but also that there is a substantial between nation effect that can not be explained by factors correlated with continental ancestry.

Here, I will discuss a new analysis involving Colombia. Colombia is marked by extensive spatial variation in  ancestry. The admixture map on the left copied from Ruiz-Linares et al. (2014) and the ethnic map on the right taken from Rodriguez-Palau et al. (2007) roughly capture the lay of the land. African admixture is concentrated along the Pacific and Caribbean coast, European admixture is highest in the north and central interior region, and Amerindian admixture is concentrated in the east and south. This ancestral variation allows for a test of our general model.
I computed the variables as follows:
Admixture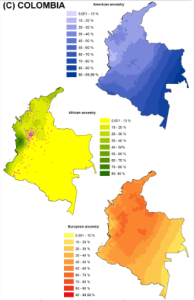 : Estimating regional admixture for Colombia’s 32 departments plus the capital was not without difficulty since existent studies provide admixture data for only half of the departments. Problematically, specific estimates for the eastern and southeastern departments, which are reported to have high Amerindian components were not available. Nonetheless, we were able to construct three sets of admixture estimates. First, 18 departmental + capital estimates were taken from Salzano and Sans’ (2014) compilation. The ancestry ratios from Salzano and Sans’ (2014) two main sources correlated at 0.9, so we felt that using the combined estimates was justified. Second, missing values were filled in based on regional values and based on Ruiz-Linares et al.’s (2014) and Rodriguez-Palau et al.’s (2007) maps. For example, estimates for Caribbean-Pacific departments were averaged and used to fill in missing data for other departments in this region. In context to the U.S., this would be akin to filling in South Carolina values using the average of the Deep South ones. Third, admixture was estimated using ethnic identity data from the 2005 census in conjunction with average ethnoracial admixture percents as reported in all available studies. The ethnoracial admixture percents came out to as follows:

The computation methods are detailed more precisely in the excel file.
Cognitive ability: For cognitive scores, the Colombian national SABER exam scores were used. The average of the 2003 and 2005 grades 5 and 8 math and reading regional scores strongly correlated with the average of the 2012 and 2014 scores (about 0.85). The scores were on different metrics, moreover standard deviations were not available for the 2003 and 2005 scores (given the source used), so, in the end, the 2012 and 2014 average scores were employed.
Other variables: 2010 HDI scores were taken from Machado (2011). Ethnic identity percents were taken from the 2005 census. Population was taken from the census via Wikipedia.
Results: I uploaded the excel file to facilitate future investigations. For the analyses reported below, in line with the general methods adopted for the meta-project, I excluded the capital and weighted by SQRT(population). Salzano and Sans’ (2014) admixture data showed only a weak negative correlation for Amerindian ancestry; this was because, as noted, data was missing for the most Amerindian parts of the country. When data was filled in, the association became significantly negative as predicted. It seems that the negative results are driven by the low scores in 5 districts (Amazonas, La Guajira, Guainía, Vaupés, and Vichada) all of which have high percents of self identifying indigenous and large reservations.

The results immediately above were replicated using the ethnic-admixture data.

Generally, European ancestry was non-trivially associated with cognitive ability (shown below) and with HDI (not shown). These results held regardless of which admixture variable was employed; they were largely driven by the strong negative association between regional outcomes and African ancestry. It is interesting that regional Amerindian ancestry was not associated with regional ability in the case of Salzan o and Sans’ (2014) admixture estimates. While on the national level, Amerindian ancestry negatively correlated with ability, as areas which were heavily populated by self-identifying Indigenous individuals did poorly, one might expect a more constant effect, one that would show up in Salzano and Sans’ (2014) restricted data set, which included only interior and coastal departments. The lack of association might have been due to the unreliability of the data, the specific samples analyzed, or the specific sampling of interior and coastal departments. Possibly, Amerindian ancestry is not negatively correlated with regional outcomes outside of largely indigenous regions. A determination of the matter will have to wait for the publication of more Colombian regional admixture data.
