Emil Kirkegaard requested an update to the Admixture in the Americas analyses, a complex task requiring, among other things, the computation of new national cognitive scores for countries and territories in the Americas. Three existing datasets are available for this purpose:
- Antilok et al.’s Harmonized Test Score (HTS) Dataset: Used to create the World Bank’s Harmonized Test Scores (HTS), this dataset covers all but three sovereign countries—Barbados, the Bahamas, and Suriname. Scores were averaged over 5-year intervals from 2000 to 2020, except for Bolivia, where data from 1995–2000 was used.
- Becker’s 2023 National IQ Scores: These measure a construct distinct from achievement scores and rely primarily on convenience samples.
- GMAT-Based Scores: Previously utilized in an earlier paper, these scores have been updated. They cover 2000–2020 data, except for small territories (e.g., Aruba, British Virgin Islands, Guadeloupe, Martinique, Montserrat, and Netherlands Antilles), where 1980s–2020 data was included due to limited 2000–2020 sample sizes and the absence of a clear secular trend.
The table below presents scores in an IQ-metric format (M = 100, SD = 15) derived from these sources. The U.S. average is standardized to 100.00. For reference, the American White scores were also added. Becker’s National IQs and GMAT scores differ from achievement-based measures: the former reflects convenience sampling, while the latter is based on unrepresentative populations (applicants to English-language MBA programs). Countries and territories lacking achievement test data are highlighted in bold.
Available Cognitive Scores for American Countries and Territories (and Countries with Overseas Territories)
| Country/ Territory | Altinok et al. | MICS6 Grade 2/3 | Becker (2023) | GMAT 00-20* | ||
|---|---|---|---|---|---|---|
| HTS | FLS | QWIQ | ||||
| M | M | M | M | N | ||
| USA White | 104.15 | 103.77 | 101.80 | |||
| USA | 100.00 | 100.00 | 100.00 | 2,111,539 | ||
| Antigua-Barbuda | 84.28 | 88.90 | 222 | |||
| Anguilla | GBR Territory | |||||
| Argentina | 84.25 | 99.58 | 106.90 | 8,761 | ||
| Aruba | NL Constituent country | 85.50 | 126* | |||
| Bahamas | 91.01 | 83.35 | 1,178 | |||
| Barbados | 95.75 | 94.00 | 619 | |||
| Belize | 71.93 | 87.85 | 405 | |||
| Bermuda | GBR Territory | 97.25 | 99.85 | 130 | ||
| Bolivia | 79.63 | 81.41 | 91.45 | 1,571 | ||
| Brazil | 81.88 | 89.13 | 103.30 | 39,174 | ||
| British Virgin Islands | GBR Territory | 81.73 | 90* | |||
| British West Indies | GBR collection of territories | 83.82 | 137* | |||
| Canada | 100.56 | 102.43 | 104.65 | 136,891 | ||
| Cayman Islands | GBR Territory | 94.45 | 119 | |||
| Chile | 85.71 | 93.94 | 104.95 | 9,290 | ||
| Colombia | 82.03 | 89.71 | 94.75 | 17,215 | ||
| Costa Rica | 86.58 | 93.16 | 97.30 | 1,774 | ||
| Cuba | 98.88 | 87.84 | 88.45 | 333 | ||
| Curacao | NL Constituent country | 82.00 | 40 | |||
| Denmark | 101.37 | 101.55 | 102.40 | 2,915 | ||
| Dominica | 83.80 | 70.08 | 84.10 | 335 | ||
| Dominican Republic | 72.86 | 93.21 | 88.30 | 1,932 | ||
| Ecuador | 81.61 | 82.30 | 89.50 | 3,659 | ||
| El Salvador | 82.94 | 93.55 | 1,395 | |||
| Falkland Islands | GBR Territory | 102.85 | 26 | |||
| France | 99.28 | 105.99 | 103.45 | 61,431 | ||
| French Guiana | FR Overseas department | |||||
| Greenland | DK Territory | 98.74 | ||||
| Grenada | 82.44 | 84.25 | 277 | |||
| Guadeloupe | FR Overseas department | 94.15 | 45* | |||
| Guatemala | 79.13 | 65.35 | 93.70 | 1,638 | ||
| Guyana | 75.19 | 92.51 | 85.60 | 555 | ||
| Haiti | 73.90 | 92.66 | 81.55 | 1,236 | ||
| Honduras | 79.58 | 87.70 | 1,583 | |||
| Jamaica | 81.30 | 85.29 | 79.23 | 86.50 | 4,470 | |
| Martinique | FR Overseas department | 91.79 | 137* | |||
| Mexico | 86.87 | 94.50 | 94.90 | 35,595 | ||
| Montserrat | GBR Territory | 92.65 | 45* | |||
| Netherland Antilles | NL Geographic region | 84.07 | 88.35 | 868* | ||
| Netherlands | 101.74 | 104.42 | 97.75 | 23,074 | ||
| Nicaragua | 77.49 | 64.28 | 90.25 | 1,010 | ||
| Panama | 77.40 | 90.10 | 1,489 | |||
| Paraguay | 77.80 | 92.65 | 446 | |||
| Peru | 79.21 | 89.40 | 102.40 | 14,566 | ||
| Puerto Rico | USA Territory | 82.78 | 85.95 | 86.20 | 1,459 | |
| Spain | 97.29 | 96.62 | 106.30 | 22,282 | ||
| Saint Barthélemy | FR Territory | |||||
| Saint Pierre and Miquelon | FR Territory | |||||
| St. Kitts and Nevis | 84.59 | 80.95 | 246 | |||
| St. Lucia | 85.89 | 86.65 | 365 | |||
| St. Martin (French) | FR Territory | |||||
| St. Martin (Dutch) | NL Constituent country | |||||
| St. Vincent & Grenadines | 81.94 | 67.48 | 83.95 | 128 | ||
| Suriname | 78.18 | 84.70 | 145 | |||
| Trinidad/Tobago | 91.97 | 90.50 | 95.35 | 2,938 | ||
| Turks/Caicos | GBR Territory | 92.12 | ||||
| United Kingdom | 100.43 | 103.38 | 108.25 | 37,542 | ||
| Uruguay | 89.72 | 105.55 | 1,226 | |||
| US Virgin Islands | USA Territory | 70.45 | 381 | |||
| Venezuela | 84.82 | 86.43 | 93.85 | 9,048 |
Compiling comparable data for the remaining American countries and territories poses significant challenges. In this and subsequent posts, I will document estimates for these regions in a series of statistical notes. One promising yet underexplored resource is UNICEF’s Multiple Indicator Cluster Surveys (MICS), accessible via IPUMS-MICS and UNICEF. MICS provides nationally representative raw data on foundational learning skills (FLS) for children aged 7–14, based on material typically taught in Grades 2–3 (ages 7–8). The skills are defined as follows:
Foundational Learning Skills (FLS) Definitions
- Reading: A child demonstrates foundational reading skills by:
- Accurately reading at least 90% of words in a Grade 2-level story (word count varies by language and country).
- Correctly answering three literal comprehension questions (e.g., “What did [name] see on [his/her] way home?”).
- Correctly answering two inferential comprehension questions (e.g., “Why is [name] happy?”).
- Numeracy: A child demonstrates foundational numeracy skills by correctly completing:
- Number reading (6 questions, e.g., “Child recognizes symbol: 48”).
- Number discrimination (5 questions, e.g., “Child identifies the larger number: 65 or 67”).
- Addition (5 questions, e.g., “Child correctly adds: 13 + 6”).
- Number pattern recognition (5 questions, e.g., “Child identifies the missing number: 20 – X – 40 – 50”).
Data Availability and Methodology
MICS data is currently available for 46 countries and territories. The raw data includes individual responses, while summary reports provide the percentage of children achieving FLS, broken down by grade and age. Although means and standard deviations could be computed or item-level biases analyzed, this analysis focuses on observed FLS percentages. Given the value of both grade- and age-based metrics, we averaged these percentages and proceeded as follows:
- Combined reading and numeracy FLS percentages.
- Developed regression equations to predict World Bank HTS scores.
For the 40 countries with both HTS and FLS data, correlations between the two measures ranged from 0.64 to 0.65.
HTS Score Estimation
HTS scores were estimated by averaging results from four regression equations:
- Grade 2/3 FLS → HTS
- Grade 2/3 HTS → FLS
- Age 8/9 FLS → HTS
- Age 8/9 HTS → FLS
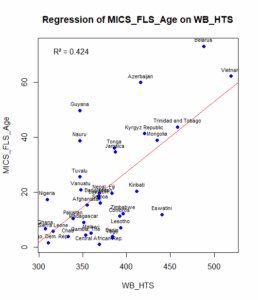
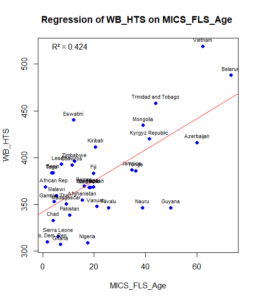
Since most countries in the dataset are low-scoring, regression equations using FLS as the dependent variable were downwardly biased for high achieving countries, while those using HTS as the dependent variable were upwardly biased for those same countries. This pattern is illustrated in the figures below. To mitigate bias, scores were computed in both directions and averaged.
Results
The dataset includes 46 estimated Harmonized Test Scores (HTS), ranging from 104 for North Korea to 71 for the Central African Republic. These results are detailed in the accompanying data file. Notable findings for countries in the Americas include:
-
-
- Suriname: Functional Literacy Score (FLS) = 78.18.
(no alternative HTS measure is available).
-
-
- Guyana: FLS = 92.51, HTS = 75.19.
-
- Jamaica: FLS = 85.29, HTS = 81.30.
-
- Turks and Caicos: FLS = 92.12 (no alternative HTS measure is available.) However, Jason Malloy identified a single IQ test, estimating an IQ of 89.4 for 150 third graders, based on Australian norms. This estimate closely aligns with the FLS-based estimate, which is calibrated relative to the U.S. mean ACHQ—a standard a few points below Australian norms.
The MICS FLS dataset offers a novel method for estimating national and international test scores, particularly for countries lacking HTS data. Future improvements could involve incorporating additional covariates or investigating item-level biases. The publicly available raw data also presents opportunities to explore hypotheses, such as potential ethnic group differences within countries. MICS surveys have either been conducted or are in preparation for Anguilla, Belize, British Virgin Islands, Cuba, Dominican Republic, Guatemala, Panama, and Saint Lucia, which will provide further data with which to update national score estimates.
Discover more from Human Varieties
Subscribe to get the latest posts sent to your email.

So the highest Graduate Management Aptitude Test for MBA school average score are people from the United Kingdom at a little over a half standard deviation higher than in the US?
I can see that makes sense. If you are a Brit who is quite ambitious you’ll stay home and get a nice job in the City of London or the like. But if you are really hot stuff, you might want to get a Stanford MBA and claw your way to the top of Silicon Valley or whatever. So American B-schools appeal more to the highest scoring Brits, while from other countries, going to an American B-school is a way to get into America, so people lower down the ladder take the test because they’d be happy to get a foot in the door in America via a second tier B-school.
I vaguely recall that Vietnam’s Northeast Asian-level score on a recent PISA test that’s incorporated into the World Bank’s Harmonized Test Scores was dubious because they only tested about 60% of the 15 year olds they were supposed to test. Vietnam’s MICS score is impressive as well, but quite as high as the PISA score.
Looking forward to the results from Cuba. Historically, Cuba’s demographic indicators have always been disguised by the government