Demographic Change and Cognitive Variation
Canada is rapidly diversifying as a result of relaxed immigration policies. According to the 2021 Census, individuals of European ancestry now constitute approximately 67% of the population, down from 83% two decades earlier. The largest non-European groups include East Asians (9%), South Asians (7%), Aboriginal peoples (6%), and Black Canadians (4%). The pace of demographic change has outstripped genetic survey estimates. For instance, Ancestry.com still reported over 90% European ancestry in Canada as recently as 2017, whereas the true proportion is now likely under 70%. Despite this shift, geographic variation in socioeconomic and cognitive outcomes continues to correlate strongly with European and Amerindian ancestry proportions. This post provides an overview of Aboriginal demographic distributions and cognitive performance in Canada.
Aboriginal Populations: Geographic Distribution
Canada’s Aboriginal populations includes three officially recognized groups: First Nations, Métis, and Inuit. Most First Nations and Métis individuals reside in the ten provinces, with roughly 40% of First Nations people living on reserves. By contrast, the Inuit are primarily concentrated in the three territories, especially Nunavut. Outside Nunavut, major Inuit populations are found in Newfoundland and Labrador (~7,000) and the Northwest Territories (~4,000).
Table 1. Geographic distribution of Aboriginal and non-Aboriginal Canadians
| Region | Total Population | First Nations | Métis | Inuit | Total Aboriginal | Non-aboriginal |
|---|---|---|---|---|---|---|
| Provinces | 36,873,821 | 1,144,065 | 586,900 | 17,015 | 1,747,980 | 35,125,841 |
| • Reservations | ~428,000 | ~428,000 | ~0 | ~0 | ~428,000 | ~0 |
| Territories | 118,160 | 19,430 | 4,290 | 53,530 | 77,250 | 40,910 |
| • Yukon | 40,232 | 6,935 | 1,285 | 260 | 8,805 | 31,427 |
| • Northwest Territories | 41,070 | 12,315 | 2,890 | 4,155 | 19,360 | 21,710 |
| • Nunavut | 36,858 | 180 | 115 | 49,115 | 49,410 | 7,448 |
| Canada Total | 36,991,981 | 1,163,495 | 591,190 | 70,545 | 1,807,250 | 35,184,731 |
Genetic Admixture of Aboriginal Populations
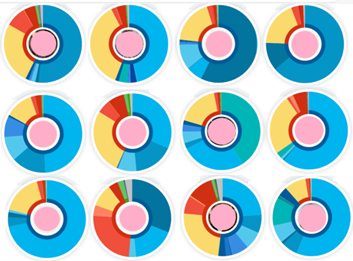
Admixture estimates for the Métis are sparse in the academic literature, but informal data from 23andMe (e.g., r/23andme subreddit) suggest approximately 65% European and 35% Amerindian ancestry, using the East Asian component as a proxy for Amerindian.
Figure 1. 23andMe admixture “donuts” for Métis individuals
First Nations individuals on reserves show average ancestry estimates of ~25% European and ~75% Amerindian, based on samples compiled from Flegontov et al. (2019), Reich et al. (2012), and Verdu et al. (2014). Off-reserve First Nations likely have higher European admixture. For Inuit, Zhou et al. (2019) report about 5% European admixture among the Nunavik Inuit of Arctic Quebec. Greenlandic Inuit, by contrast, average about 25% European ancestry, though this is lower in eastern Greenland near Nunavut. For context, Moreau et al. (2013) report ~2% Amerindian admixture in the French Canadian population. Estimated admixture — this are admittedly rough estimates –is summarized in Table 2.
Table 2. Estimated admixture for White/European Canadians and Indigenous groups
| European % | Amerindian % | ||
| European Canadians | 0.98 | 0.02 | |
| Metis | 0.65 | 0.35 | |
| First Nations | 0.25 | 0.75 | |
| Inuit | 0.05 | 0.95 | |
Academic Achievement Gaps
In other posts, we have discussed the aptitude test scores of various ethnic groups. Given Canada’s rapidly changing population, it is difficult to keep pace. Regarding Aboriginal populations specifically, most academic achievement data in Canada pertain to off-reservation individuals residing in the ten provinces. This means the Yukon, Northwest Territories, and Nunavut are typically excluded. Approximately 40% of Aboriginal students live either on a reserve or in one of the territories, resulting in a substantial portion of the Aboriginal population—particularly First Nations and Inuit—not being represented in these datasets.
The most comprehensive data available for off-reserve Aboriginal students in the provinces come from the Pan-Canadian Assessment Program (PCAP), which evaluates the academic performance of 8th-grade students every three years. Administered by the Council of Ministers of Education, Canada (CMEC), PCAP publishes contextual reports for each assessment cycle, focusing on a specific domain (Mathematics, Reading, or Science). Mean scores are standardized with a total standard deviation (SD) of 100. Results from 2010 to 2019, converted into Cohen’s d values, are summarized in Table 3. Off-reserve First Nations and Inuit students perform approximately d = –0.55 to –0.60 below the non-Aboriginal mean, while Métis and individuals of mixed Aboriginal and non-Aboriginal ancestry—who likely have similar levels of European ancestry—score around d = –0.30 below non-Aboriginals.
Table 3. Achievement gaps (Cohen’s d) on PCAP tests
| Metis | Mixed aborig. / not | First Nations | Multiple aborig. | Inuit | |
| Math 2010 | 0.4 | 0.54 | 0.62 | ||
| Science 2013 | 0.31 | 0.54 | 0.84 | ||
| Reading 2016 | 0.23 | 0.56 | 0.31 | ||
| Math 2019 | 0.31 | 0.28 | 0.69 | 0.58 | 0.42 |
| Average | 0.31 | 0.28 | 0.58 | 0.58 | 0.55 |
These performance patterns are also evident at the provincial level. While most provinces do not disaggregate achievement data by specific Aboriginal groups, Ontario is an exception. The Government of Ontario (n.d.) reports pass rates—defined as achieving Level 3 or 4—on provincial Mathematics and Reading assessments (EQAO). Table 4 presents these pass rates converted into Cohen’s d scores, assuming a normal distribution. Métis and First Nations students perform similarly to the results observed in the PCAP data. Because the vast majority of Métis reside in the provinces and outside of reserves, the available achievement data are broadly representative of Métis performance.
Table 4. Test score gaps between Aboriginal and non-Aboriginal students in Ontario (Cohen’s d, EQAO assessments)
| Metis | First Nations | Inuit | ||||||
|---|---|---|---|---|---|---|---|---|
| Subject | N | d | N | d | N | d | ||
| Math_2011 | 337 | 0.33 | 1399 | 0.7 | ||||
| Math_2012 | 409 | 0.3 | 1549 | 0.7 | ||||
| Math_2013 | 454 | 0.3 | 1760 | 0.62 | 47 | 0.18 | ||
| Math_2015 | 536 | 0.39 | 1994 | 0.67 | 69 | 0.39 | ||
| Reading_2011 | 337 | 0.26 | 1399 | 0.6 | 24 | 0.57 | ||
| Reading_2012 | 409 | 0.19 | 1551 | 0.61 | 28 | 0.46 | ||
| Reading_2013 | 454 | 0.13 | 1759 | 0.5 | 47 | 0.22 | ||
| Reading_2015 | 536 | 0.35 | 1995 | 0.57 | 69 | 0.75 | ||
| Ave. | 0.29 | 0.62 | 0.44 |
Another valuable data source—particularly for adult populations—is the 2012 Programme for the International Assessment of Adult Competencies (PIAAC). Summary scores from this dataset, as reported by the Council of Ministers of Education, Canada (CMEC), and Indigenous Services Canada (ISC, n.d.), include participants from all three territories, thereby capturing Inuit populations in Nunavut. However, the data remain limited to off-reservation individuals. A key advantage of the PIAAC dataset is its disaggregation of scores by whether the respondent’s mother tongue matches the language of the test (see Figure 2.12 for Literacy and Figure 2.13 for Numeracy). Table 5 summarizes comparisons between Aboriginal and non-aboriginal individuals whose mother tongue corresponds to the test language.
Table 5. Test score gaps (Cohen’s d) between Aboriginal and non-Aboriginal individuals with matching test and mother tongue languages based on PIAAC 2012
| Metis | First Nations | Inuit | |
| N | 2025 | 2238 | 472 |
| d | d | d | |
| Literacy | 0.18 | 0.52 | 0.96 |
| Numeracy | 0.26 | 0.68 | 1.34 |
| Average | 0.22 | 0.6 | 1.15 |
The results suggest that differences are not simply due to linguistic bias since they show up among individuals who grew up speaking English or French. Adjusting for territorial distribution and on-reserve effects suggests Inuit, overall, score approximately d = 0.80 below non-aboriginals.
What about on reservations first nations? Bacic and Zheng (2024) report that on-reserve Indigenous students in British Columbia score approximately d = 0.38 below their off-reserve counterparts. Similarly, the Government of Ontario (n.d.) indicates that during the 2013–14 school year, only 19% of on-reserve Indigenous students met acceptable standards in mathematics, and 26.5% did so in reading. Based on the EQAO pass rate data used for Table 4, these figures correspond to an average performance roughly d = 0.64 below that of off-reserve Indigenous students—who themselves scored d = 0.62 below the non-Indigenous average. Taken together, these findings suggest that on-reserve First Nations students perform approximately one standard deviation below the non-Indigenous mean. Averaging across on- and off-reserve populations, the total First Nations population appears to score around d = 0.80 below the non-Indigenous population.
IQ Test Scores
For the Admixture in the Americas update, our primary focus is on achievement test scores. Nonetheless, it is worth revisiting IQ-based findings, particularly as only a handful of studies published in the 21st century have reported IQ data for Indigenous populations in Canada.
Inuit Populations
Two notable studies examine Inuit samples in Arctic Quebec. Jacobson et al. (2014) report a mean IQ of 91.8 among 282 Inuit children, based on a culturally adapted version of the U.S. Wechsler Intelligence Scale for Children (WISC). A consistent pattern—also observed in First Nations populations—is evident: relatively higher performance on spatial subtests and lower scores on verbal comprehension, processing speed, and working memory.
Plusquellec et al. (2007) provide corresponding data for the mothers of these children (N = 165–169). On the Peabody Picture Vocabulary Test (PPVT), the mothers averaged 68.2. On Raven’s Standard Progressive Matrices (SPM), they scored an average of 34.7 raw. Because these women fell outside the SPM age norms, the raw score was converted using the Advanced Progressive Matrices (APM) norms using Becker’s (2023) tables. The corresponding APM score of 5.15 (rounded down to 5) for a mean age of 24.9 (rounded up to 25) yields an estimated IQ of 65.84. Applying a Flynn Effect correction (to the converted APM-based score) reduces this by an additional 3.99 points. Additionally, Faucher (1999) reported an average SPM score of 35.9 for 44 Inuit adults (mean age = 24.6) from Nunavik. This corresponds to an APM score of 6.02, which is equivalent to an IQ of 68.27 when rounded to age 25. Applying a Flynn Effect correction reduces this by 4.20 points.
Due to the heterogeneity across tests and the assumptions involved in converting SPM raw scores to standardized scores, we refrain from calculating a combined average. For broader context, Lynn (2016) reports a mean IQ of 91 for Arctic populations across Alaska, Canada, and Russia. The key point for our analysis is that both IQ and achievement scores for Inuit populations are comparatively low.
First Nations Populations
We identified nine 21st-century studies reporting IQ data across 11 First Nations samples:
-
Diaz (2005): WAIS-III Matrix Reasoning score of 9.02 for 42 on-reserve adults in British Columbia. Assuming this is a scaled subtest score (M = 10, SD = 3), this corresponds to an IQ of 95.1.
-
Morin (2006): Average IQ of 91.49 for 49 children on a Saskatchewan reserve, using the Das–Naglieri Cognitive Assessment System (CAS), a test specifically designed to be less culturally biased.
-
Root (2006): Root (2006) reported SPM scores on Forms A–D of 33.16 (N = 38) for students who later dropped out and 38.34 (N = 25) for those who graduated. According to Becker (personal communication, May 8, 2025), the conversion equation to the full form (A–E) is:
SPM_RS(A–E) = 0.0133 × [SPM_RS(A–D)]² + 0.4547 × [SPM_RS(A–D)] + 5.7301.
Applying this formula yields estimated raw scores of 35.43 and 42.71, respectively. Using Becker’s (2023) norms and an estimated age of 13.5, the corresponding IQ equivalents are 81.26 and 93.80. Adjusting for the Flynn Effect reduces each score by 3.99 points. -
Vanderpool & Catano (2008): Among 101 young adults (ages 18–28), CFAT = 87, SPM = 96, along with Mill Hill Vocabulary and Wonderlic scores. Differential item functioning analyses showed minimal cultural bias. Spatial abilities were comparable to the general military recruit population.
-
Dela Cruz & McCarthy (2010): PPVT-IV mean of 98.3 for 44 off-reserve children in Alberta Head Start.
-
Vicaire (2011): An average SPM score of 36.66 on Forms A–D was reported for 53 children in remote First Nations schools. Using the conversion formula referenced in relation to Root (2006), this corresponds to a full-form (A–E) raw score of 40.27. Based on Becker’s (2023) tables and an estimated age of 14, the corresponding IQ is 88.61. Applying a Flynn Effect correction reduces this by 6.09 points.
-
Janzen et al. (2013): CAS scores of 86.32 (N = 84, Alberta) and 91.49 (N = 49, Saskatchewan).
-
Babcock (2017): WISC-IV mean of 94.96 for 60 off-reserve First Nations children, compared to 100.6 for White children in the standardization sample.
-
Hanson (2019): WISC-IV mean of 78.56 for 102 First Nations children in the Northwest Territories. Subtest analysis showed relatively strong visual-spatial performance and weaker verbal scores.
Excluding the Diaz (2005) result and averaging across the remaining ten samples (with multiple test scores averaged for Vanderpool & Catano (2008), the unadjusted weighted mean IQ for 21st century First Nations individuals is approximately 88.47. Applying Flynn Effect corrections would lower this by one to two points. Lynn (2016), analyzing five Canadian studies from 1968–1987, reports a similar average of 85.2. While individual conversions may be debated, Lynn’s overall estimate appears broadly accurate. Most of these studies focus on individuals living on reserves, which aligns with achievement data indicating performance approximately one standard deviation below the non-Indigenous mean. The average for the broader First Nations population—especially off-reserve individuals—would likely be somewhat higher.
Thus, in this case, IQ test results align closely with academic achievement outcomes. For both First Nations and Inuit populations, scores are consistently lower than those of the non-aboriginal population. IQ test results are summarized in Table 6.
Table 6. IQ results across studies.
| Author | Test | N | FSIQ M | Flynn corrected FSIQ | Verbal | Spatial | Fluid | Working Memory | Processing | |||
|---|---|---|---|---|---|---|---|---|---|---|---|---|
| Diaz (2005) | Martix subtest, WAIS-III | Native American | Califonia, LA | 64 | 98.35 | |||||||
| Martix subtest, WAIS-III | Native American | British Columbia reserves | 42 | 95.1 | ||||||||
| Morin (2006) | CAS | First Nations | Saskatchewan reserve | 49 | 91.49 | No | ||||||
| Root (2006) | SPM | First Nations | Quebec reserve U | 38 | 81.26 | 77.27 | ||||||
| Root (2006) | SPM | First Nations | Quebec reserve A | 25 | 93.80 | 89.81 | ||||||
| Vanderpool & Catano (2008) | First Nations | remote Manitoba | 101 | |||||||||
| CFAT | 87 | No | 89 | 95 | ||||||||
| SPM | 96 | No | 42 | |||||||||
| MHV | 91 | No | 28 | |||||||||
| Wonderlic | 88 | No | ||||||||||
| General population Recruits | 108 | |||||||||||
| CFAT | 104 | No | 104 | 99 | ||||||||
| SPM | 101 | No | ||||||||||
| MHV | 100 | No | ||||||||||
| Wonderlic | 106 | No | ||||||||||
| dela Cruz & McCarthy (2010) | PPVT-IV | Aboriginal | Alberta off reseve | 44 | 98.3 | No | ||||||
| Vicaire (2011) | SPM | First Nations | remote schools | 53 | 88.61 | 82.52 | ||||||
| Janzen et al. (2013) | CAS | Native Children | Alberta reserve | 84 | 86.32 | No | ||||||
| Janzen et al. (2013) | CAS | Native Children | Saskatchean reserve | 49 | 91.49 | No | ||||||
| Babcock (2017) | WISC-IV CAN | |||||||||||
| Asian | 96 | 102.34 | No | |||||||||
| Caucasian | 647 | 100.6 | No | |||||||||
| First Nation | Off reservation | 60 | 94.98 | No | ||||||||
| Other | 77 | 95.92 | No | |||||||||
| Hanson (2019) | WISC-IV CAN | First Nations | Northwest territories | 102 | 78.56 | No | 77.47 | 93.21 | 86.01 | 80.97 | 84.34 | |
| Faucher (1999) | SPM | Inuit | Nunavik | 44 | 68.27 | 64.07 | ||||||
| Plusquellec et al. (2007) | Inuit | Arctic Québec | 165-169 | |||||||||
| PPVT USA | 68.2 | No | ||||||||||
| SPM | 65.84 | 61.85 | 34.7 | |||||||||
| Jacobson et al. (2014) | WISC-IV USA, Inuit adapted | Inuit | Arctic Québec | 282 | 91.8 | No | 84.5 | 94.2 | 89.5 | 86.6 | ||
Conclusion
In Canada, both achievement and IQ tests consistently reveal cognitive disparities between Aboriginal and non-Aboriginal populations, particularly among First Nations and Inuit. These differences are observed nationwide and within provinces & territories and persist even when matching on language. Given the markedly uneven regional distribution of Aboriginal populations across Canada, we can reasonably expect that Amerindian ancestry will be negatively correlated with both cognitive ability and socioeconomic status across Canadian regions. In Part 2, we examine whether this prediction holds.
References
Babcock, S. E. (2017). Examining the influence of demographic differences on children’s WISC-V test performance: A Canadian perspective [Master’s thesis, University of Western Ontario].
Bacic, R., & Zheng, A. (2024). Race and the income‐achievement gap. Economic Inquiry, 62(1), 5–23.
Becker, D. (2023, October 25). National IQ dataset (Version 1.3.5) [Dataset].
Council of Ministers of Education, Canada (CMEC), & Indigenous Services Canada (ISC). (n.d.). Adult competencies among Indigenous Peoples in Canada: Findings from the first cycle of the Programme for the International Assessment of Adult Competencies (PIAAC). Government of Canada.
Dela Cruz, A. M., & McCarthy, P. (2010). Alberta Aboriginal Head Start in urban and northern communities: Longitudinal study pilot phase. Health Promotion and Chronic Disease Prevention in Canada, 30(2).
Diaz, S. H. (2005). Differences in cognitive strengths between Native North Americans living in rural versus urban environments [Doctoral dissertation, Fielding Graduate University].
Faucher, C. (2002). Étude des associations entre le développement cognitif et la qualité de l’environnement familial dans la population inuit du Nunavik. National Library of Canada= Bibliothèque nationale du Canada, Ottawa.
Flegontov, P., Altınışık, N. E., Changmai, P., Rohland, N., Mallick, S., Adamski, N., … & Schiffels, S. (2019). Palaeo-Eskimo genetic ancestry and the peopling of Chukotka and North America. Nature, 570(7760), 236–240.
Government of Ontario. (n.d.). Strengthening our learning journey: Third progress report on the implementation of the Ontario First Nation, Métis and Inuit education policy framework.
Hanson, J. (2019). Exploratory factor analysis of the Canadian Wechsler Intelligence Scale for Children—for a sample of First Nations students [Master’s thesis, Eastern Illinois University].
Jacobson, J. L., Muckle, G., Ayotte, P., Dewailly, É., & Jacobson, S. W. (2015). Relation of prenatal methylmercury exposure from environmental sources to childhood IQ. Environmental Health Perspectives, 123(8), 827–833.
Janzen, T. M., Saklofske, D. H., & Das, J. P. (2013). Cognitive and reading profiles of two samples of Canadian First Nations children: Comparing two models for identifying reading disability. Canadian Journal of School Psychology, 28(4), 323–344.
Lynn, R. (2016). Race differences in intelligence: An evolutionary analysis (2nd rev. ed.). Washington Summit Publishers.
Moltke, I., Fumagalli, M., Korneliussen, T. S., Crawford, J. E., Bjerregaard, P., Jørgensen, M. E., … & Albrechtsen, A. (2015). Uncovering the genetic history of the present-day Greenlandic population. The American Journal of Human Genetics, 96(1), 54–69.
Moreau, C., Lefebvre, J. F., Jomphe, M., Bhérer, C., Ruiz-Linares, A., Vézina, H., … & Labuda, D. (2013). Native American admixture in the Quebec founder population. PLOS ONE, 8(6), e65507.
Morin, T. L. (2006). A cognitive approach to word-reading for First Nations children [Master’s thesis, University of Saskatchewan].
Plusquellec, P., Muckle, G., Dewailly, É., Ayotte, P., Jacobson, S. W., & Jacobson, J. L. (2007). The relation of low-level prenatal lead exposure to behavioral indicators of attention in Inuit infants in Arctic Quebec. Neurotoxicology and Teratology, 29(5), 527–537.
Reich, D., Patterson, N., Campbell, D., Tandon, A., Mazieres, S., … & Bustamante, C. D. (2012). Reconstructing Native American population history. Nature, 488(7411), 370–374.
Root, R. (2008). Predictors of educational attainment among Naskapi adolescents [Doctoral dissertation, McGill University].
Vanderpool, M., & Catano, V. M. (2008). Comparing the performance of Native North Americans and predominantly White military recruits on verbal and nonverbal measures of cognitive ability. International Journal of Selection and Assessment, 16(3), 239–248.
Verdu, P., Pemberton, T. J., Laurent, R., Kemp, B. M., Gonzalez-Oliver, A., Gorodezky, C., … & Malhi, R. S. (2014). Patterns of admixture and population structure in native populations of Northwest North America. PLOS Genetics, 10(8), e1004530.
Vicaire, M. (2011). Cultural identity, intelligence, and self-esteem: Towards enriching the understanding of academic outcomes in a community of First Nation students [Master’s thesis, McGill University].
Zhou, S., Xie, P., Quoibion, A., Ambalavanan, A., Dionne-Laporte, A., Spiegelman, D., … & Rouleau, G. A. (2019). Genetic architecture and adaptations of Nunavik Inuit. Proceedings of the National Academy of Sciences, 116(32), 16012–16017.
Discover more from Human Varieties
Subscribe to get the latest posts sent to your email.

Leave a Reply