In the previous post, we noted that across Canada—and within individual provinces and territories—Métis, First Nations, and Inuit populations tend to underperform relative to non-Indigenous Canadians. To illustrate this, Table 1 presents average PIAAC literacy and numeracy d-values comparing Aboriginal and non-Aboriginal individuals whose mother tongue matches the language of the test (English or French), disaggregated by province and territory where data are available. Higher positive d-values indicate worse performance among Aboriginal groups. While the magnitude of the gaps varies by region, the disparities are consistently present.
Table 1. Average PIAAC Literacy and Numeracy d-Values Between Non-Aboriginal and Aboriginal Individuals by Canadian Province/Territory (Mother Tongue Matches Test Language)
| Non-aboriginal / Metis d | Non-aboriginal / First Nations d | Non-aboriginal / Inuit d | |
|---|---|---|---|
| Canada | 0.21 | 0.56 | 1.18 |
| Ontario | 0.21 | 0.49 | NA |
| Manitoba | 0.23 | 0.81 | NA |
| Saskatchewan | 0.4 | 0.77 | NA |
| British Colombia | 0.22 | 0.59 | NA |
| Yukon | 0.46 | 0.87 | NA |
| Northwest Territories | 0.52 | 1.2 | 1.11 |
| Nunavut | NA | NA | 1.67 |
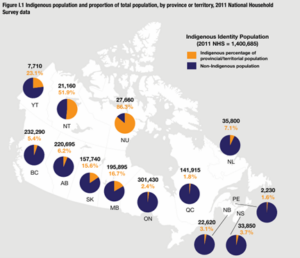
Given these disparities, along with the considerable variation in the geographic distribution of Indigenous populations, depicted in Figure 1, it is reasonable to expect that Amerindian admixture will correlate with regional cognitive outcomes—particularly with lower scores in the northern regions. In contrast, some, such as Professor Leon, have proposed that regional differences in cognitive performance reflect variation in UV radiation exposure.
Figure 1. Indigenous Population as a Percentage of the Total Population by Canadian Province/Territory
To investigate we computed first order administrative division (FOAD) cognitive and SES-related scores as follows:
1. Cognitive ability
We computed unit-weighted averages of math/numeracy and reading/literacy scores from four 21st-century assessments:
• School Achievement Indicators Program (SAIP), 2001–2002 — includes data from the Northwest Territories, Nunavut, and Yukon
• Pan-Canadian Assessment Program (PCAP), 2007 and 2010 — includes Yukon
• Program for the International Assessment of Adult Competencies (PIAAC), 2012 — includes the Northwest Territories, Nunavut, and Yukon
• Programme for International Student Assessment (PISA), 2009, 2012, 2015, 2018, and 2022 — limited to the provinces
PISA covers only the provinces. PCAP included Yukon in 2007 and 2010, while both SAIP and PIAAC included all three territories. The average correlation among scores from these four assessments across FOADs was r = .69, justifying their combination.
2. Province / Territory ancestry
Due to Canada’s rapid demographic change, published genetic ancestry estimates—such as those from Ancestry.com (2017)—are now outdated. More reliable estimates can be generated by weighting self-identified race/ethnicity (SIRE) percentages by the corresponding average genetic ancestry. This approach requires a few simplifying assumptions. We assume that most visible minority groups are genetically unadmixed, with the exception of Black and Latin American populations. For instance, individuals identified as Filipino are assumed to be 100% East Asian. This assumption is supported by their recent immigration history and admixture data from their countries of origin.
For Black Canadians from the West Indies, we apply admixture patterns found among Anglo-Caribbean populations, estimating an average of approximately 80% African and 20% European ancestry, while for Black Canadians from Africa we assumed 100% African ancestry. For Latin Americans—based on common countries of origin such as Mexico and Brazil—we use average admixture levels observed in U.S. Hispanic populations.
For Aboriginal groups, we rely on previously calculated admixture averages and apply them to relevant subgroups (e.g., Métis, First Nations). In cases where individuals are identified as mixed Aboriginal and non-Aboriginal, we use the European Canadian average for the non-aboriginal component, given that the non-Aboriginal population in Canada has historically been overwhelmingly of European descent.
While not a perfect method, this approach is grounded in common sense and is consistent with that used by Putterman and Weil (2010).
3. HDI and S-factor scores\
We obtained HDI estimates for 2005, 2010, 2015, and 2020 from Smits and Permanyer (n.d.) and averaged them. To compute S-factor scores, we used the OECD Regional Well-Being dataset (https://www.oecdregionalwellbeing.org/), applying principal factor analysis (PFA) with mean replacement. The variables included were: Education, Jobs, Income, Safety, Health, Accessibility of Services, and Housing. The first factor accounted for 61% of the total variance. Summary values are showing in Table 2.
Table 2. Summary Variables for Canadian Regions
| Region | Population | % European | % Arab | % African | % Amerindian | % East Asian | % South Asian | % Other | IQ | HDI | S-factor |
|---|---|---|---|---|---|---|---|---|---|---|---|
| Canada | 36328475 | 0.705 | 0.019 | 0.04 | 0.048 | 0.093 | 0.071 | 0.024 | 100.56 | ||
| Newfoundland and Lab | 502100 | 0.883 | 0.003 | 0.007 | 0.085 | 0.01 | 0.009 | 0.002 | 97.37 | 0.874 | 0.62 |
| Prince Edward Island | 150480 | 0.874 | 0.007 | 0.011 | 0.036 | 0.043 | 0.025 | 0.004 | 97.09 | 0.864 | 0.149 |
| Nova Scotia | 955860 | 0.86 | 0.011 | 0.027 | 0.048 | 0.026 | 0.023 | 0.006 | 98.12 | 0.872 | 0.376 |
| New Brunswick | 759195 | 0.898 | 0.007 | 0.015 | 0.049 | 0.017 | 0.011 | 0.004 | 97.47 | 0.866 | 0.735 |
| Quebec | 8308480 | 0.816 | 0.034 | 0.048 | 0.046 | 0.03 | 0.015 | 0.011 | 103.1 | 0.887 | 0.828 |
| Ontario | 14031755 | 0.644 | 0.02 | 0.051 | 0.034 | 0.106 | 0.108 | 0.037 | 101.13 | 0.899 | 0.229 |
| Manitoba | 1307185 | 0.682 | 0.006 | 0.033 | 0.108 | 0.105 | 0.054 | 0.012 | 97.97 | 0.869 | -0.736 |
| Saskatchewan | 1103200 | 0.752 | 0.005 | 0.019 | 0.11 | 0.066 | 0.041 | 0.007 | 97.74 | 0.882 | 0.496 |
| Alberta | 4177715 | 0.688 | 0.017 | 0.04 | 0.053 | 0.113 | 0.071 | 0.018 | 101.83 | 0.902 | 0.791 |
| British Columbia | 4915940 | 0.624 | 0.006 | 0.013 | 0.045 | 0.186 | 0.096 | 0.03 | 100.65 | 0.895 | 1.184 |
| Yukon | 39585 | 0.737 | 0.001 | 0.013 | 0.142 | 0.076 | 0.026 | 0.005 | 97.48 | 0.866 | -0.778 |
| Northwest Territories | 40380 | 0.539 | 0.006 | 0.024 | 0.345 | 0.062 | 0.019 | 0.006 | 94.03 | 0.893 | -1.433 |
| Nunavut | 36600 | 0.199 | 0.001 | 0.014 | 0.768 | 0.011 | 0.005 | 0.002 | 81.47 | 0.801 | -2.461 |
Table 3 presents partial correlations—weighted by the square root of population size—with non-focal ancestry (i.e., ancestry other than Amerindian, African, and European) statistically controlled. European ancestry is positively associated with IQ, the S-factor, and HDI, while Amerindian ancestry is negatively associated with all three outcomes. African ancestry shows a positive association with IQ and HDI; however, this likely reflects the settlement of highly selected African immigrants in high-performing FOADs such as Ontario and Quebec. Many of these individuals are recent migrants with elevated educational and occupational profiles. As such, their characteristics—like those of Asian immigrants—do not reflect historical admixture patterns and therefore fall outside the intended scope of our Admixture in the Americas project.
Table 3. Correlation Matrix for Canadian FOAD
| Amerindian | African | European | ACHQ | S-factor | |
|---|---|---|---|---|---|
| Amerindian | – | ||||
| African | –.221 | – | |||
| European | –.982 | 0.032 | – | ||
| ACHQ | –.795 | 0.563 | 0.704 | – | |
| S-factor | –.671 | –.119 | 0.71 | 0.657 | – |
| HDI | –.640 | 0.489 | 0.56 | 0.827 | 0.576 |
The provincial-level results also replicate at the subprovincial level at least when using education attainment as an outcome. For example, Statistics Canada reports college attendance rates for 293 municipalities. These rates correlate at –.40 with Amerindian ancestry and at –.41 with Aboriginal self-identified race/ethnicity (SIRE). Since data are available for both Aboriginal and non-Aboriginal populations, it can be demonstrated mathematically that the observed correlations are driven by an Indigenous-specific effect, rather than by other factors varying between municipalities. Data attached.
Overall, despite Canada’s rapid demographic change, regional variation in outcomes continues to reflect performance differences between historical groups—namely, Aboriginal and European Canadians.
References
Organisation for Economic Co-operation and Development (OECD). (n.d.). OECD Regional Well-Being. https://www.oecdregionalwellbeing.org
Putterman, L., & Weil, D. N. (2010). Post-1500 population flows and the long-run determinants of economic growth and inequality. The Quarterly journal of economics, 125(4), 1627-1682.
Smits, J. and Permanyer, I. The Subnational Human Development Database. Sci. Data. 6:190038 https://doi.org/10.1038/sdata.2019.38 (2019).
OECD Regional Well-Being
Discover more from Human Varieties
Subscribe to get the latest posts sent to your email.

Leave a Reply