Year: 2013 (Page 5 of 6)

By way of introduction

A long-time reader and an occasional commenter (under various pseudonyms) in the “Steveosphere”, I’m making my debut as a blogger on these topics. My intention is to post both empirical analyses and more general pieces touching on human biodiversity.

My professional background is not in psychometrics, genetics, or anything related. However, I believe that diligent amateurs can break new ground on these topics, as exemplified by John Fuerst’s work at Occidental Ascent. While HBD is thriving in academia in the form of research programs on individual differences, research on race differences is moribund. Amateurs will have to pick up the slack.

Others have remarked that they cannot entirely disentangle their interest in HBD from their political views. This applies to me, too, and I think, probably naively, that hard-hitting discoveries in HBD could mitigate some of the more negative trends in Western society. But more on that later, perhaps.

I can be contacted at mr_dalliard at hotmail dot com.

Spearman's hypothesis and the NLSY97-ASVAB, part 1

According to Spearman’s hypothesis, black-white gaps on cognitive tests are larger on tests that are better measures of g, or general mental ability. If g is the only or main source of the black-white gap, it indicates that within- and between-race differences are qualitatively similar and that understanding the nature of the racial gap requires that we understand the nature of g.

One of the ways that the late Arthur Jensen used to test the hypothesis was the method of correlated vectors (MCV). It involves factor analyzing a battery of cognitive tests taken by a sample of individuals from different races, and correlating the resultant vector of g loadings with the magnitudes of racial differences on each subtest of the battery. The expectation is that tests with higher g loadings are associated with larger racial gaps. Jensen did a number of analyses of this kind, and found that the average correlation between g loadings and subtest differences across many different samples of blacks and whites was 0.63 (after correction for unreliability), supporting the notion that g is the main source of the black-white gap. Analyses of Hispanic-white gaps have also generally supported the idea that g is their major source.

John Fuerst and I studied Spearman’s hypothesis in the NLSY97 sample. The sample sizes in the NLSY97 are ~4400 for whites, ~2300 for blacks, and ~1800 for Hispanics, although they may be lower in specific analyses below. We mostly followed the procedures in Nyborg & Jensen 2000, although we used principal axis factoring rather than PCA. The NLSY97 participants took the ASVAB, which comprises the following tests:

General Science (GS)
Arithmetic Reasoning (AR)
Word Knowledge (WK)
Paragraph Comprehension (PC)
Numerical Operations (NO)
Coding Speed (CS)
Auto Information (AI)
Shop Information (SI)
Mathematics Knowledge (MK)
Mechanical Comprehension (MC)
Electronics Information (EI)
Assembling Objects (AO)

The ASVAB yielded a similar two-factor structure across the black, white, and Hispanic samples. The first factor, which we identified as g, explains about 60 percent of the variance in the ASVAB, while the second factor explains about 10 percent; the rest can be regarded as test-specific variance and measurement error. The second factor is not very easily interpretable, but I would tentatively consider it as representing technical knowledge because it has some of its highest loadings on the Auto and Shop Information tests, which have questions like this:

A fuel-injected engine does not need:

(A) spark plugs
(B) a fuel pump
(C) a carburetor
(D) an alternator

The ASVAB is the Armed Services Vocational Aptitude Battery, so it contains also items that would not show up in a typical IQ test. I’ll call the second factor the T factor.

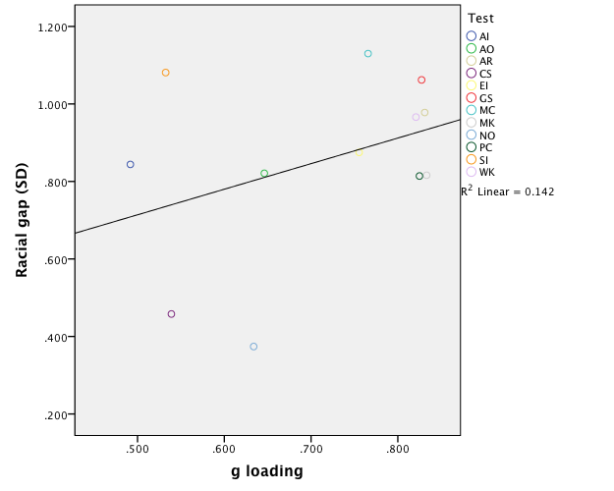
We correlated the averaged g loadings of each race/ethnicity pair with the magnitudes of white-black, black-Hispanic, and white-Hispanic gaps on each ASVAB test. All the Pearson’s r and Spearman’s rho analyses showed small to moderate positive correlations, none of which were statistically significant at conventional levels (significance testing is based on Spearman’s rho in these analyses, see Nyborg & Jensen 2000 for details). For example, here’s the scatter plot from the black-white analysis:
Image

Pearson’s r’s for white-black, black-Hispanic, and Hispanic-white comparisons were 0.38, 0.12, and 0.39, respectively, while the corresponding Spearman correlations were 0.14 (ns), 0.077 (ns), and 0.287 (ns).

However, it could be that the expected correlations aren’t there because of confounding due to different reliabilities of the tests. However, controlling for reliabilities doesn’t substantially change the results (not shown here).

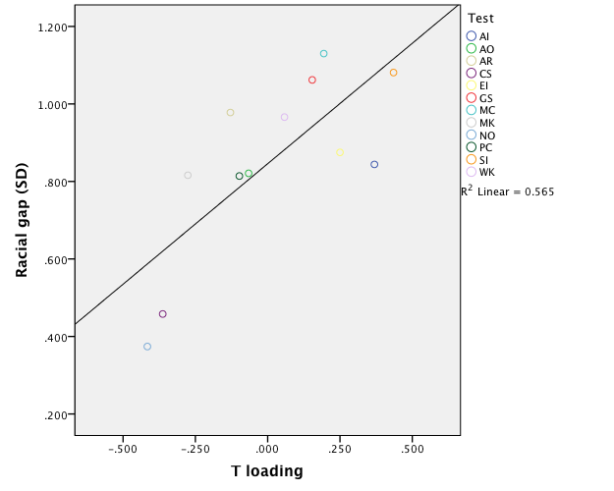
Therefore, the MCV does not support the hypothesis that g is driving the racial/ethnic differences in the ASVAB tests. So what then explains the fact that gaps differ across tests? I correlated the loadings of the second factor, the T factor, with differences in test means between whites, blacks, and Hispanics. Surprisingly, the T factor is strongly (r=0.75, rho=0.72) and highly significantly (p<0.01) correlated with the magnitudes of the gaps in the black-white analysis. The results hold even when partialling out reliabilities. The scatter plot looks like this:
Image

In the black-Hispanic and Hispanic-white analyses the results are broadly similar, although the correlations are somewhat smaller and not always significant. Thus the racial/ethnic gaps are not only not explained by differences in g loadings, but are in fact explained by loadings on the T factor which is uncorrelated with g! Does this mean that T and not g is the main source of racial/ethnic differences in ASVAB abilities? In fact, it does not indicate that, and these analyses only demonstrate the shortcomings of the MCV.

One way of studying how different factors contribute to differences between the mean scores of races/ethnicities is to do a point biserial correlation between each racial/ethnic dichotomy and scores on each test and partial out factor scores on either factor. Here’s the results from the black-white analysis (all the results below are significantly different from zero unless otherwise indicated):

Zero-order g partialled out T partialled out
GS 0.358 0.052 0.337
AR 0.339 .003 ns 0.377
WK 0.321 .002 ns 0.322
PC 0.284 -0.083 0.317
NO 0.130 -0.143 0.261
CS 0.170 -0.060 0.275
AI 0.295 0.111 0.217
SI 0.368 0.188 0.317
MK 0.279 -0.067 0.357
MC 0.378 0.111 0.350
EI 0.289 -.006 ns 0.249
AO 0.297 0.034 0.315

As can be seen, partialling out g scores removes most of the gaps in all tests, while partialling out T scores has only a small effect. Thus g is the main source of cognitive differences between blacks and whites, while T is a minor source. For some reason, T is nevertheless a major source of differences between the relative sizes of gaps on different tests, which is why the MCV analysis fails.

The results from Hispanic-white analyses are rather similar:

Zero-order g partialled out T partialled out
GS 0.262 0.068 0.238
AR 0.198 -0.054 0.212
WK 0.236 0.036 0.222
PC 0.179 -0.069 0.188
NO 0.139 -0.020 0.207
CS 0.105 -0.045 0.162
AI 0.19 0.068 0.148
SI 0.248 0.106 0.206
MK 0.175 -0.056 0.214
MC 0.211 -0.002 ns 0.181
EI 0.216 0.026 0.179
AO 0.097 -0.101 0.114

Finally, black-Hispanic differences:

Zero-order g partialled out T partialled out
GS 0.102 -0.012 0.122
AR 0.167 0.081 0.224
WK 0.09 -0.032 0.121
PC 0.12 -0.004 ns 0.163
NO -0.028 -0.162 0.075
CS 0.072 -0.027 0.147
AI 0.127 0.060 0.105
SI 0.14 0.117 0.159
MK 0.117 -0.018 0.189
MC 0.208 0.168 0.229
EI 0.073 -0.024 0.100
AO 0.256 0.192 0.272

Overall, these results support the hypothesis that g is the major source of racial/ethnic differences in the ASVAB, particularly between whites and blacks. The analysis also shows that the MCV is a flawed method, which is of course well known. For example, according to Ashton and Lee 2005, “first, associations of a variable with non-g sources of variance can produce a vector correlation of zero even when the variable is strongly associated with g; second, the g-loadings of subtests are highly sensitive to the nature of the other subtests in a battery, and a biased sample of subtests can cause a spurious correlation between the vectors.”

Multi-group confirmatory factor analysis appears to be a much better method for testing Spearman’s hypothesis. At the moment, that method is unfortunately beyond my skills and patience.

In part 2 of this post I’m going to extend this analysis to differences in skin color.

See here for John’s SPSS syntax for combining the ASVAB variables (there are two of them for each test), regressing out the effect of age on ASVAB scores, and performing a factor analysis on the ASVAB.

Introduction to: The HBD Bibliography‏

An editor from The HBD Bibliography‏ sent the following:

The HBD Bibliography

Web: http://www.humanbiologicaldiversity.com Twitter: https://twitter.com/#!/HBDBibliography Email: hbdbibliography@gmail.com

Greetings! I’m one of the editors of the HBD Bibliography. I became interested in HBD about five years ago, began to read widely in the field, and started to maintain a bibliography of things I had read (a habit from grad school). I shared this bibliography with others, and we decided to put it on line so others could benefit from it. I do not claim to be an expert on HBD; the bibliography is part of my learning experience as well. After we had put the bibliography online, we received many emails from people suggesting materials, so the bibliography has grown at least tenfold in size. While we don’t agree with every book or article on the bibliography, we put them out there so others could benefit from them. There are hyperlinks for all the books, articles and blog posts on the reading list. Many of the journal articles and books have hyperlinks to free PDFs on various websites. If you can think of anything that should be added or corrections that should be made, please email them to hbdbibliography@gmail.com. Please also email new articles, blog posts and books. We’ll typically tweet blog posts (to our 2,500 followers), and tweet and add to the bibliography books and articles. (We’re trying to cut back on adding blog posts to the bibliography, unless they’re exceptional.) I hope you enjoy. Please share the bibliography with friends and colleagues.

HVGIQ: Haiti

Lynn’s international dataset lacks data for Haiti. The Global Bell Curve (2008) simply reports “Nothing is known of the intelligence of the population of Haiti” (p. 147). IQ and the Wealth of Nations (2002) estimates an IQ of 72 by regional comparison with Jamaica. IQ and Global Inequality (2006) estimates an IQ of 67 by comparison with Jamaica, St. Lucia, and Dominica. This is the estimated value still reported in Intelligence (2012).

I have, however, located three intelligence studies for Haiti. Continue reading

The Limits of Selectivity

Figure 1 below shows the last five years of SAT scores for African Americans who were a part of the Department of Defense educational system (DoDEA) and for those who were not (Nation). The former, the children of enlisted personal, perform almost 0.3 standardized units better than the latter. Elsewhere, I have documented that this 0.3 difference can be found in DoD schools both in the US and abroad.

Figure1.  SAT

An obvious explanation for the DoDEA/ Nation difference is parental selectivity. Entrance into the military is mostly limited to those with AFQT z-scores above -1 relative to a US national mean of 0. As the Black cognitive ability mean is about -1, on the same scale, only the upper half of the Black population is qualified for entrance into the military; as a result, Africa American recruits represent, on average, the 75th percentile of the Black cognitive ability distribution. As such, those selected should be about 0.67 SD (standardized units) above the African-American mean. Given the coefficient of assortative mating typically reported in the literature of 0.33, and assuming a trivial number of Military-Military parings, a random pair of African Americans, for which one individual is or was a member of the military, should have a mid parent IQ 0.45 SD above that of a random pair for which neither individual is or was a member of the military. Multiplying by the typically found coefficient of regression of 0.6 gives one a military, non-military offspring difference of about 0.27 – and this would account for the DoDEA/Nation difference in full. In theory. Continue reading

Introducing myself : Meng Hu

I don’t know where to begin. If I have to introduce myself I could say that I’m chinese, that my english is awful, that no one knows who I am, and that the average reader of this blog is probably much older than me. Also, it is clear that Jason Malloy and John Fuerst have followed the IQ-race debate for many years now and I am not as knowledgeable as they are – far from it – but knowledgeable enough to write this. To be honest, around two years ago I didn’t even know that blacks have a lower cognitive ability than any other races, as assessed by IQ tests, until I came across this paper “Thirty Years of Research on Race Differences in Cognitive Ability” – in February/March 2011 if I remember correctly. This has caused a stir in my mind, and struck my curiosity. Since that day, I wanted to be better informed, collecting information and data that either reject or confirm the theory posited by the hereditarians. Gradually I was moving to the dark side. You could say I am a hereditarian now.

Among all the books and papers I have read so far, I would highly recommend Arthur Jensen (e.g., The g Factor, Educability & Group Differences, Bias in Mental Testing). I think he is the one who has made the most devastating criticisms against the environmental-cultural hypothesis, and James Flynn being the toughest opponent of the hereditarian side. I am not particularly interested in the consequences of the victory of one side over the other, but if I have to say a word about my political view, which is not worth discussing, the only thing I would say is that no one (and even asians – at least those who live in western countries) would agree with me. I indeed see all the advantages of an ethnically homogeneous country, regardless of the tenability of the “race realism” thesis, which has become my new obsession. My goal in joining this blog is to pursue what I was constantly trying to succeed in for these two last years : refuting the race realism case. And I have not yet succeeded.

The Human Varieties Global IQ Dataset

Richard Lynn’s international intelligence dataset has proved useful to many different researchers. (For example, in the year 2012 it was used by Hafer, Jones, Kalonda-Kanyama, Rindermann, Woodley.) His dataset has also been criticized over its accuracy and thoroughness. Although this data has been elaborated and corrected over time, some errors have been persistent. For example, IQ & the Wealth of Nations (2002) reported an IQ of 59 for Equatorial Guinea, based on a small study by Fernández-Ballesteros et al. (1997). Lynn subsequently emphasized this as the lowest national score in the dataset (Lynn & Vanhanen 2006, pp. 1-2), and this peculiarity, paired with a meager sample size (N=48), made it an easy target for critical reviewers already discomfited by the low values for Africa in general (Barnett & Williams 2004; Berhanu 2007). However, only veteran anti-hereditarian, Leon Kamin, bothered to eventually check the reference, and indeed, he found a major error: the sample was taken from a school for mentally handicapped children. But even Kamin’s reading was inadequate, and the full extent of the error wasn’t reported until Wicherts et al. (2010): Continue reading

What if the BW IQ difference is entirely due to environment ?

What happens if the Black-White IQ difference is entirely environmental in origin ? I argue here that we cannot be certain that the gap will disappear, and it is even possible that the gap would have increased if the between-group heritability (BGH) of IQ was lower than what it actually is.

Insofar as the socio-economic status (SES) is an index of cognitive stimulation, through wealth, culture, life style, parental expectations, parenting, and so on, it would be useful to examine the magnitude of the IQ gap at different levels of SES.
Continue reading

The magnitude of the BW gap with parental education in the NLSY97

I examine here the magnitude of the BW gap at different levels of parental education, using the NLSY97. You need to download a collection of variables in the NLS Investigator. The relevant ones for the present analysis are R1302400, R1302500, R1482600, R0538700, R0538600, and R9829600. You can check these variables using the “Variable Search” option in the NLS Investigator. And you may need a SPSS or PSPP program. In the SPSS (or PSPP) program, click on File, Open, and then Syntax, to upload the collection of variables you have downloaded from the NLS I (you should have transferred  your files into a new file located in your “Documents and Settings” folder). Recall that your handle file should look like this, or otherwise the recoding will not work.

Continue reading

Greetings

Welcome to Human Varieties. My name is Jason, and I’ve inhabited the “Sailersphere” for some 12 years, mostly as a drive-by datamonkey and armchair theorist in comment sections. I can fairly be described as a hereditarian, and my Internet presence has loosely been fashioned around that paradigm and its allied disciplines. I used to contribute, however infrequently, to Razib Khan and Godless Capitalist’s Gene Expression group blog between 2003-2008, drawing the most attention with my review of Richard Lynn’s Race Differences in Intelligence, my discussion of cognitive ability and sexual behavior, and my defense of James D. Watson in 2007. The Watson post, in particular, had three interesting consequences. First, I was contacted and interviewed by earnest New York Times reporter, Amy Harmon. This interview was used for her DNA age article, which subsequently (and not unjustly) won the Pulitzer Prize. Second, I was invited to adapt my post into an editorial for the journal Medical Hypotheses by then Editor-in-Chief, Bruce Charlton. Most remarkably, though, I was called and thanked personally by the great man, James Watson himself! (The comical mismatch between my obscurity and Watson’s eminence, unfortunately, underscores the alarming ubiquity of his ill treatment during that whole manufactured scandal.) Watson even invited me to dine with him personally in early 2008; this was all the more flattering (and not a wee bit ironic) given that he had just published a book titled Avoid Boring People!

Since that time—an eternity in Internet years—John Fuerst has emerged as a much more meticulous and energetic hereditarian dilettante than I ever was or could be. However we have different things we can contribute to our overlapping interests and goals, and furthermore, we are not the only people who could use an active forum for exploring these issues in greater depth. So we started this website to assemble and nurture an online community of human diversity sleuths who can collaborate, respond to, and build off each other’s labor. Ideally, this site can serve as both an alternative to and a launching pad for standard published journal research.

If you have any questions or would like to join this blog as a contributor, please send me an email.

__________________________________________

__________________________________________

« Older posts Newer posts »

© 2026 Human Varieties

Theme by Anders NorenUp ↑