Introduction
We have shown, amongst other things, that pre-market measures of IQ substantially statistically explain the association between color and outcomes in the US. This implies that the adult color-outcome differences are substantially caused by IQ differences, rather than vice versa. To investigate this issue further, I have taken a longitudinal approach.
As background, it is well established that the year to year correlation for IQ is mediated by general intelligence on the psychometric level and by shared genes and shared environment on the causal levels. The latter two sources contribute to the longitudinal stability of IQ. Unshared environment, on the other hand, does not. This situation is illustrated in the table immediately below. As is shown, the longitudinal stability of IQ scores for both Blacks and Whites is conditioned by genetic and shared environmental effects. For the Add Health sample, in particular, unshared environment contributes only to longitudinal change.
(From: Beaver, et al. (2013). The genetic and environmental architecture to the stability of IQ: Results from two independent samples of kinship pairs. Intelligence, 41(5), 428-438.)
It follows then that if differences are due to shared genes and shared environment, as we propose, then the IQ-color association should be largely on a factor common across ages. Moreover, IQ at earlier ages should explain some of the IQ-color correlations at a latter ages. Overall, the association between color and IQ should have longitudinal stability. It is, of course, not necessary that it does. If, for example, labor marker color discrimination was leading to outcome differences which were, in turn, leading to IQ difference, the pre-market and post-market color-IQ correlations would not be mediated by a common factor. Likewise, if idiosyncratic individual factors such as peer group influences were conditioning the differences, one would not expect longitudinally stable color associated IQ differences (since such idiosyncratic influences don’t condition longitudinally stable IQ differences).
To explore this issue, I took advantage of the longitudinal nature of the nationally representative Add Health survey (1994-2008). In this survey I was able to locate four measures of cognitive ability spanning three waves: PPVT in wave 1 (PPVT1), PPVT in wave 3 (PPVT3), Backwards Digit Span in wave 4 (BDS), and timed recall, also, in wave 4 (TR). For these waves, the individuals were, respectively, ages 12-18, ages 18 -26, and ages 24-32. I limited my consideration to African Americans who were US citizens by birth. I defined African Americans as people who identified as being African American in waves 1, 3 and 4, non-Hispanic in waves 1 and 3, and who were also identified as being a US citizen by birth in waves 1 and 3. The data file can be found here and the syntax with results can be found here.
Results
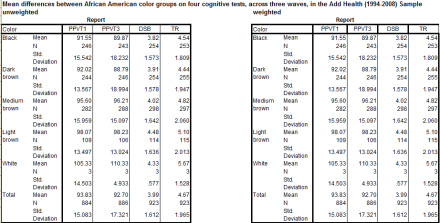
Table 1 presents the unweighted and weighted descriptive statistics for the four ability tests by skin color. Color was interviewer rated in wave 3 based on a 5 point scale, running from 1 (darkest) to 5 (lightest). For weights, per the instructions, since I was conducting a longitudinal analysis, I used the weights of the final wave used (i.e., wave 4).
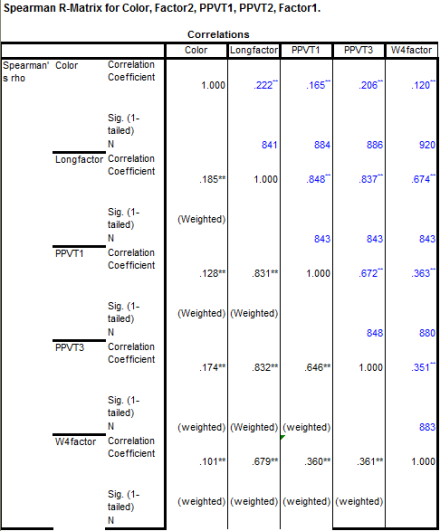
To simplify the analysis, I factor analyzed the two wave 4 measures (BDR and TR). I labeled this extracted factor: W4factor. I found that the W4factor correlated higher with the wave 1 and 2 measures in addition to the variable of interest, skin color, then did either of the wave 4 measures independently. The R-matrixes are presented in table 2. I then created a longitudinal factor, by factor analyzing wave1 PPVT scores, wave 3 PPVT scores, and the W4factor. The R-matrixes are shown in figure 3 and figure 4. The weighted values are in black under the diagonal. It is notable that the color association was largest on the general longitudinal factor.
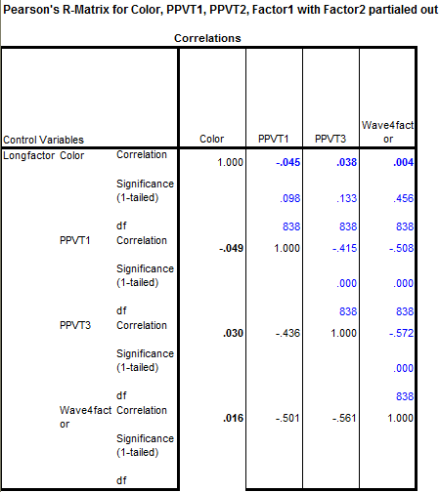
To see to what extent the longitudinal factor accounted for the wave, age, and test specific associations, I looked at the correlations between color, PPVT1, PPVT3, and the W4factor with the longitudinal factor partailed out. The results are shown in figure 5, with weighted results presented below the diagonal. The longitudinal factor accounted for most of the associations. In short, the association between color and cognitive ability is on the factor common across ages at least within the Black population.
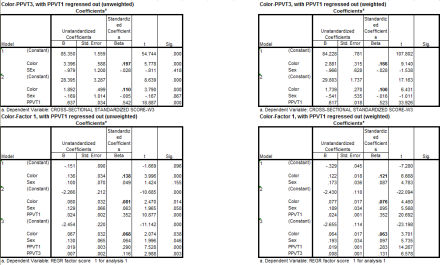
I explored this topic in more detail by looking to see to what extent cognitive ability at earlier ages could explain the correlations between color and ability at latter ages. Figure 6 shows the regression results. The amount explained by cognitive ability at earlier ages was consistent with the claim that the color association in on the longitudinal factor. For example, the weighted correlation (r) between PPVT1 and PPVT3 was 0.55. The correlation between color and PPVT3 was 0.17. When PPVT1 was entered into the equation the association dropped to .10. This is about what one would expect given the PPVT1-PPVT3 correlations if, in fact, the color associations were on a common factor.
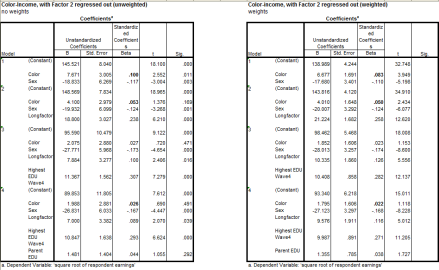
Next, I replicated Meng Hu’s results using the Longitudinal factor. Figure 7 and 8 shows the results. The longitudinal factor explained two-thirds of the wave 4 education gap and one-half of the income gap. Another quarter of the income gap is explained by parental education and individual education. This factor is reasonably predictive.
After, I looked at the association between reported white ancestry, color, and the longitudinal factor. The results are shown in figure 9. The association between color and reported White ancestry was higher on the longitudinal factor.
I then looked at the association between reported White ancestry and the longitudinal factor, controlling for color and then at the association between color and the longitudinal factor, controlling for ancestry. The results are shown in figure 10. The results are similar to what was found before: the color-IQ and reported ancestry-IQ associations weakly co-vary; this is consistent with our proposed model as explained before.
Lastly, I looked at the mean race/ethnicity gaps in the longitudinal factor. And in the W4 factor. Those are reported in figure 11.
Discussion
As expected, the association between color and IQ amongst African Americans was mostly explained by a common factor across ages. This factor presumably closely indexes general intelligence, since the longitudinal stability of IQ is mostly mediated by g. These findings demonstrate that the color-IQ correlations found amongst contemporaneous African American adults are largely a product of underlying differences in a longitudinally stable general ability, the origins of which can be traced backed to pre-adult years, and the source of which is some combination of shared environment and shared genes — since these are the sources which condition such stability.
Discover more from Human Varieties
Subscribe to get the latest posts sent to your email.






I am a little bit surprised that the extracted commun factor correlates higher with reported white ancestry. As I said before, I am still not convinced by this factor, given the small numbers of tests factor analyzed and the limited variety of tests. Nevertheless, its higher correlation may be worth investigating. A study released yesterday (26 March 2013) in ScienceDirect might be of interested for you : Is the Flynn effect on g?: A meta-analysis. te Nijenhuis shows that when correction for sampling error, reliability of vectors of g loadings, range restriction of g loadings, deviation from perfect construct validity, were done, the negative relationship between g loadings and secular IQ gains goes from -0.26 to -0.38. That is worth trying if you wish to extend further Jensen’s MCV to other kind of analyses.