Page 2 of 16

The SAT and Racial/Ethnic Differences in Cognitive Ability

The SAT is the most popular standardized test used for college admissions in the United States. In principle, SAT scores offer a good way to gauge racial and ethnic differences in cognitive ability. This is because, psychometrically, the SAT is just another IQ test–that is, it is a set of items the responses to which can be objectively marked as correct or incorrect.[Note 1] Unsurprisingly, SAT scores correlate strongly with scores from other IQ tests (Frey & Detterman, 2004). It is also advantageous that SAT-takers are generally motivated to get good scores, and that large numbers of young people from all backgrounds take the test each year, enabling precise estimation of population means.

However, the SAT has at least two major limitations when used for group comparisons. Firstly, it is a high-stakes college entrance test, which means that it is a target for intense test preparation activities in ways that conventional IQ tests are not, potentially jeopardizing its validity as a measure of cognitive ability. Secondly, taking the SAT is voluntary, which means that the participant sample is not representative but rather consists of people who tend to be smarter and more motivated than the average.

This post will attempt to address these shortcomings. I will investigate whether racial and ethnic gaps in the SAT are best understood as cognitive ability gaps, or if other factors make a significant contribution, too. An important method here is to compare the SAT to other tests that are not subject to extraneous influences such as test prepping. Another goal of the post is to come up with estimates of racial/ethnic gaps in the test that are minimally affected by selection bias. This can be done with data from states where entire high school graduate cohorts take the SAT. Other topics that will receive some attention in the post include ceiling effects, predictive validity, and measurement invariance.

Because racial/ethnic gaps in the SAT have changed over time, an essential part of the analysis is understanding these temporal trends. In particular, Asian-Americans have performed extraordinarily well in the test in recent years. Getting a better handle on that phenomenon was a major motivation for the post. Comparisons of trends in the national and state-level results turned out to be informative with respect to this question.

The post is multipronged and somewhat sprawling. This is because the (publicly available) SAT data do not yield straightforward answers to many important questions about racial and ethnic differences. The only way to get some clarity on these issues is to examine them from multiple angles, none of which alone supplies definitive answers, but which together, hopefully, paint a reasonably clear picture. I have relegated many technical details of the statistical methods used, as well as many ancillary analyses, to footnotes so as make the main text less heavy-going. The data and R code needed to reproduce all the calculations, tables, and graphs in this post are included at the end of each chapter, or, in the case of some ancillary analyses, in the footnotes.

Continue reading

Math abilities of transracial adoptees in the HSLS: Parent education does not moderate group differences

Transracial adoption studies, especially ones which examine the performance of adopted blacks, are lacking since the prominent Minnesota Transracial Study of Black adoptees (Weinberg et al., 1992, Table 2). To fill this gap I analyzed the HSLS data, and found that the math abilities of transracial adoptees do not depend on the adoptive parents’ race. Continue reading

IQ scores by ethnic group in a nationally-representative sample of 10-year old American children

Note: We computed these results based on multiple versions of the ABCD data (v2.01 & v3.01) and with different inclusion/exclusion criteria.  I originally posted a version based on the ABCD 2.01 data filtered for missing admixture, and other scores. However, after looking, I found a version that uses the maximum 3.01 sample with age-corrected NIHTBX scores (N = 11474).  While the scores for the two versions correlate at r = .98, in some cases (e.g., Vietnamese), there is a notable difference.  I have now replaced the original table with the one based on N = 11474 and moved the original table to the end of the post.  For replicability and modifiability, I attached the latest R code which I had in my file.

……

In our manuscript, titled “Reply to Warne,” we present average eduPGS and NIH Toolbox composite scores from the ABCD study, categorized by ethnic and religious groups. In our analyses, we used unweighted means instead of sample weighted scores, since we were only interested in the correlation between mean eduPGS and cognitive ability. However, we also computed weighted NIH Toolbox scores, which may be of interest to some readers.

These scores were computed using the survey package for R as recommended by Heeringa and Berglund (2020). These weighted scores, reported below, represent the “neuropsychological performance” scores, measured between 2016 and 2018, of broadly representative samples of 10-year-old American children. (Though, children were excluded, by the ABCD consortium, if they were not fluent in English or if one of their parents were not fluent in either English or Spanish.) The first three columns, after the group labels, display the sample size, means, and standard deviations, respectively. The fourth column presents the scores normalized with the non-Hispanic White mean set to 100.00 and standard deviations set to 15.00. To norm scores, we pooled the standard deviations across all groups (pooled SD = 16.45) and transformed the values using the pooled SD. On a reader request, I added average years of parental education, which I previously outputted, in the fifth column.

The ethnic groups are mutually exclusive, and the specific variables used to code them are provided in the supplementary materials of the manuscript. Classifications are based on the race/ethnicity of the child as reported by the responding parent in conjunction with the nationality and immigrant status of the parents; see the Parent Demographics Survey for specific variables and the second table for definitions. To be clear, some of the definitions do not perfectly overlap with ones commonly used in the social sciences. For example, the classification “USA Blacks” refers to children who were identified as being Black, not being White, not being Hispanic, but also not having an immigrant parent or grandparent. This was done because, when computing the scores, we were interested in mutually exclusive ethnocultural groups.

Bear in mind that the sample sizes are often small and so the corresponding estimates are imprecise and also that the NIH Toolbox battery is fluid-intelligence loaded. For comparison, Sailer, in 2009, reported cognitive abilities of legal American immigrants based on the digit span backwards test. Additionally, in 2015, I summarized scores by immigrant generation and ethnic groups mostly based on scholastic tests.

Ethnic/National GroupNMSDIQ-Metric Score Parental Education (Years)
Chinese81116.5321.02111.3216.95
Korean & Japanese33115.1319.15110.0516.36
White & Asian Indian44114.6614.19109.6216.75
White & Korean/Japanese78111.4118.02106.6515.89
White & Chinese77109.7718.16105.1616.42
White & Filipino60109.6718.09105.0716.16
Filipino51107.9917.53103.5315.5
Other Asian52106.820.17102.4615.91
Asian Indian53106.7717.03102.4216.8
White5858104.1116.5110015.45
White & Pacific Islander25103.7416.999.6615.47
Vietnamese24102.6814.5198.6915.95
N. Africa & Mid. East47100.3320.0196.5614.92
Pacific Islander1799.7912.1896.0614.07
White & Native American14499.3215.3695.6314.51
Central & South American35298.3616.9894.7614.15
Not Identified21796.6917.7893.2413.4
Dominican3895.116.6591.7913.99
White Mexican77595.116.3791.7812.8
White Cuban15194.981691.6713.92
NH Black & White41894.9316.9191.6314.14
Other Hispanic51894.5617.7591.2913.95
White Puerto Rican13394.2217.2390.9813.74
Black African5993.8413.4190.6314.97
Other Cuban3092.8118.389.6914.33
Native American3992.2916.189.2213.14
Other Mexican46091.8216.0288.7911.9
Black Caribbean5191.7416.7988.7214.26
Black & Other Puerto Rican9090.6115.4987.6913.22
USA Black149985.4414.882.9813.32

Continue reading

The Untold Group Interaction in the Black-White IQ Gap

When observable measures such as socio-economic and health factors are adjusted, the IQ gap is substantially reduced yet a non-trivial difference remains. And while it is known that environmental factors are influenced by genetic factors and therefore should be not treated as pure environmental effects, an outcome that is typically ignored is that the education-matched blacks fall further behind in the IQ scores when education level increases.

Continue reading

How Autism Drives Human Invention: But Is It Just Autism?

In The Pattern Seekers: How Autism Drives Human Invention (2020), Baron-Cohen proposes the Systemizing Mechanism as an explanation for human progress through invention, from the first tools to the digital revolution. Autistic people tend to be hyper-systemizers, due to their repetitive behavior and obsessive interest. With their talent at spotting novel patterns which produce a potentially groundbreaking result, they have potential to be inventors. They are those who can’t help focusing on precision and detail and figure out how a system works, how to improve a system.

Continue reading

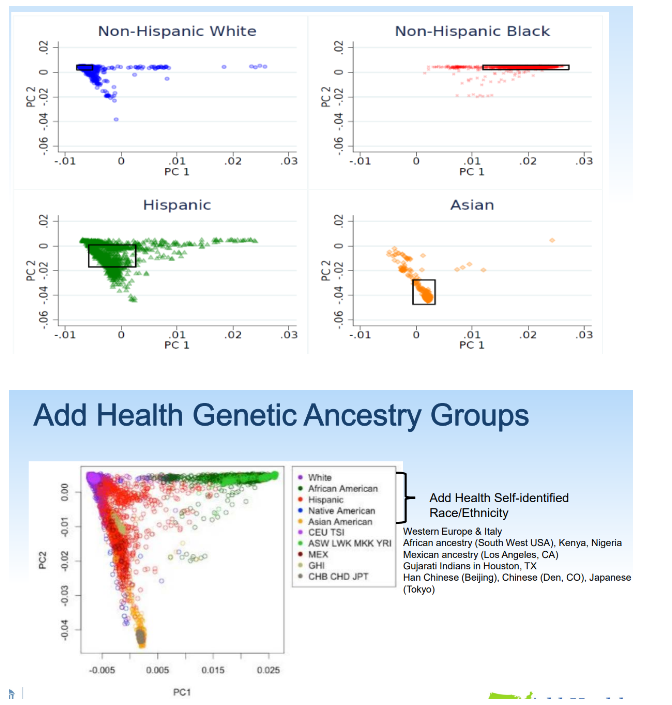
Decoding Admixture Results

Race/ethnic cognitive/academic achievement gaps are considered so important in the social sciences that number 4 in the social science’s top 10 list of “grand challenge questions that are both foundational and transformative” (Giles, 2010) is: “How do we reduce the ‘skill gap’ between black and white people in America?” Illustrating just how much effort has been focused on this topic, Google scholar yields 48,200 search results when queried for “race” and “achievement gaps.” The concern is arguably well justified as race/ethnic-related social outcome gaps can largely be accounted for by differences in cognitive ability (e.g., Fryer, 2014).

Given the intensity of academic interest in this subject, the fact that only a handful of researchers are focused on understanding why achievement gaps so tightly track genetically-identified ancestry within socially-identified racial/ethnic groups is indeed curious. For instance, in Guo, Lin, & Harris (2019), the authors report results for Peabody Picture Vocabulary based on the ADD Health sample. In Table 3 of said publication, among Hispanic and non-Hispanic Blacks, ancestry principle components PC1 and PC3 are strongly associated with verbal intelligence. And among non-Black Hispanics, ancestry principle components PC2 and PC3 show the strongest association.

In their report, Braudt & Harris (2020) provide the Rosetta Stone for interpreting these otherwise opaque results. PC1, in this sample, separates Sub-Saharan African ancestry from out-of-African ancestry, while PC2 separates European ancestry from non-European out-of-African ancestry. PC3 is not shown, but we can deduce from the distribution among Black and non-Black Hispanics that it separates out Amerindian ancestry. In other words, in this large national sample – just as in the nationally representative Adolescent Brain Cognitive Development study (Fuerst, 2021) – African and Amerindian genetic ancestry are strongly negatively related to intelligence among socially-defined Blacks and Hispanics.

Once again, despite these robust findings, armies of sociologists nominally interested in the source of racial and ethnic-related cognitive/academic achievement gaps continue to flagrantly ignore genetic ancestry. Not only do they ignore such results, but they also censor them. Thus, predictably, the published version of Guo, Lin, & Harris (2019) drops the results for non-Whites, along with Table 3 shown above, on reviewers’ insistence. Other researchers, who have looked at predictors of cognitive ability, have informed me that reviewers similarly have demanded PCs in place of more interpretable ancestry percentages and then, also, that the PC variables not be reported in the tables.

So, unsurprisingly Google Scholar yields just 48 hits, or two orders of magnitude fewer search results, for “genetic ancestry” and “achievement gaps.” But why? One has to suspect that our sociologists are not particularly interested in understanding the true cause of race/ethnic differences. Reality evasion continues unabated in academia.

References

Braudt, D., & Harris, K. M. (2020). Polygenic scores (pgss) in the national longitudinal study of adolescent to adult health (add health)–release 2.

Fryer, R. (2014). 21st-century inequality: The declining significance of discrimination. Issues in Science and Technology, 31(1), 27-32.

Fuerst, J. G. (2021). Robustness analysis of African genetic ancestry in admixture regression models of cognitive test scores. Mankind Quarterly, 62(2).

Giles, J. (2011) Social science lines up its biggest challenges. Nature, 470(7332):18–19.

Guo, G., Lin, M. J., & Harris, K. M. (2019). Socioeconomic and genomic roots of verbal ability. bioRxiv, 544411.

How Well Personality Traits Predict Social Outcomes? It’s Complicated…

How much the 5 personality traits composing the Big Five contribute to social outcomes? Many studies examined the question but only a few also considered IQ. This article will only cover the studies which evaluate the Big Five while controlling for IQ.

A quick summary reads as follows: conscientiousness is associated with better income and health, extraversion inversely predicts delayed rewards, neuroticism negatively predicts health, perhaps none of these traits are related to academic achievement or occupation status and, finally, publication bias is a problem.

Continue reading

DIF Review and Analysis of Racial Bias in Wordsum Test using IRT and LCA

As reviewed in my previous article, the majority of studies on measurement bias, either on the item- or subtest-level, reached an agreement about the fairness of IQ test. Unfortunately, even among studies which use acceptable Differential Item Functioning (DIF) methods, the procedure was often sub-optimal. This probably leads to more spurious DIFs being detected.

The advantages (and shortcomings) of each DIF method are presented. The GSS data is used to compare the performance of the two best DIF methods, namely IRT and LCA, at detecting bias in the wordsum vocabulary test between whites and blacks.
Continue reading

Fair and Square: A Conclusion on IQ Test Bias

This is a 2-part article. In this first part, the most important studies on internal test bias with respect to racial groups in the item-level, subtest-level and construct-level are reviewed. The proposed causes will be discussed. Generally, the most commonly used IQ tests aren’t biased or only minimally biased as to be of no practical value.

The best methodologies with an application using the Wordsum GSS for the Black-White group will be discussed in the second part of the article : DIF Review and Analysis of Racial Bias in Wordsum Test using IRT and LCA.
Continue reading

Schooling enhances IQ, not intelligence

The idea that schooling raises intelligence still prevails. The influential study review of Ceci (1991) concluded that schooling has a strong impact on IQ scores despite his final warning that observed score does not equate real intelligence. After, many more studies were published, including latent factor modeling and quasi-experimental designs. It is unclear whether education truly improves general intelligence modeled as latent factor or whether long-lasting IQ gain involves far transfer effect. More likely, the answer to all of these questions is negative.

Continue reading

« Older posts Newer posts »

© 2024 Human Varieties

Theme by Anders NorenUp ↑