This is a 2-part article. In this first part, the most important studies on internal test bias with respect to racial groups in the item-level, subtest-level and construct-level are reviewed. The proposed causes will be discussed. Generally, the most commonly used IQ tests aren’t biased or only minimally biased as to be of no practical value.
The best methodologies with an application using the Wordsum GSS for the Black-White group will be discussed in the second part of the article : DIF Review and Analysis of Racial Bias in Wordsum Test using IRT and LCA.
CONTENT
- Introduction to the concept of bias.
- Differential Item Functioning: Study review.
2.1. Understanding DIF.
2.2. Item test of racial bias.
2.3. Item test of gender bias.
2.4. Latent Class Analysis. - Multi-Group Confirmatory Factor Analysis: Study review.
3.1. Introducing MGCFA.
3.2. Traditional method.
3.3. Alignment method. - Discussion.
1. Introduction to the concept of bias.
Two kinds of bias can be distinguished. Internal bias and external bias. The first refers to the difference in probability of answering an item correctly. The second refers to predictive bias, precisely, between-group difference in the correlation between the test and some external criterion variables such as educational attainment and other measures of success.
Jensen’s review (1980, ch. 10-12) shows that predictive bias is rarely seen in practice, as well as internal bias. But because internal bias is much more complex, this article will focus only on this kind of bias, sometimes termed Differential Item Functioning, or DIF. More generally, we talk about measurement equivalence or invariance. That happens when two groups have been equated in total IQ score (or better, latent score) but the groups have different probabilities in scoring any given item right, on the assumption (which is rarely precised) that the test measures only one cognitive ability (such as, reasoning, verbality, memory, speed). Assumption that is called unidimensionality. When the test measures several cognitive abilities, matching on total score results in false positives (FPs) with regard to DIF because of imperfect matching on all abilities, compared with the situation when the subtest(s) only is (are) used.
The DIF is an indication that a certain group, be it gender or race, has a persistent advantage over the other group in responding this particular item correctly, even though they have the same total score. DIF may be caused by a difference in knowledge related to that item, but not necessarily so. Some items would appear more easy for one group and others would be more easy for the other group. Among potential (non-exclusive) explanations, differential exposure to some specific knowledge, complex or poor wordings, high dependency on cultural or school knowledge, differences in test-taking strategies, test-retest effects. And even poor translation for between-country studies (Oliveri et al., 2012, p. 205). When designing IQ test, one must also guard against floor (too easy items) and ceiling (too difficult items) effects. DIFs occuring at the end or the beginning of a given test can be related to these artifacts.
Historically, the most debated question pertained to culture fairness with respect to cultural groups. Obviously, the more culture-loaded a test is, the more likely there would be culture bias among groups of different cultural and socio-economic background. If after equating for true cognitive ability, blacks and whites do not differ in any item score, it means that item response solely depends on ability and not race-related factors. The absence of DIF may also suggest the absence of psychological barrier when taking the IQ test. It has been wrongly suggested that stereotype threat depresses black scores, assumingly because at the very moment black people are completing the questions, and despite having the ability (or knowledge) they don’t understand (or remember) how to answer due to stress and stereotype-like effects. Wicherts et al. (2005) were one of the first to prove it. The causal mechanism may be related to emotion. Several studies linked DIFs magnitude to differences in interest, motivation, etc. (Stricker & Emmerich, 1999; Pae, 2012).
An illustration is given by Roussos & Stout (1996):
In the case of disadvantaging one of the two groups, the secondary dimension may be a content area that elicits an inappropriate emotional response that distracts the examinee, preventing or clouding the cognitive processes needed to solve the item. The March 3, 1995, issue of The Chronicle of Higher Education provided an extreme example of such an item. According to The Chronicle, a physics professor at MIT recently included the following question on an exam:
You are in the forefront of a civil rights demonstration when the police decide to disperse the crowd using a water cannon. If the cannon they turn on you delivers 1000 liters of water per minute, what force does the water exert on you? (p. A-33)
As reported in The Chronicle, a senior in the Black Student Union at MIT pointed out, “If a question like that draws out an emotional response in a student, his or her mind is no longer on Physics” (p. A-33).
If such psychological factor affects response probability, it would necessarily distort the item response function in statistical analyses. Among other but less discussed psychological factors, one is the guessing strategy. Guessing makes error variances larger and decreases the reliability and validity of the test. If not modeled, as is possible in the IRT framework, biased estimations might occur (Santelices & Wilson, 2012). Yet another one is timing factor which occurs when the subject tends to accelerate in their time of response at the end of a given subtest/test. Such behavior increases the probability of mistakes, especially if the difficulty increases at each subsequent item, as is usually the case in IQ tests. Evidence of such effect from differential solution strategies is provided by Tatsuoka et al. (1988) and Must & Must (2013). Generally, the completion of all the items doesn’t mean the subjects haven’t tried to guess or accelerate their rate of response at the end of the time limit.
As we will see in Section 2, most studies don’t seek to explain the pattern of bias or why it occurs. Some exception includes Tellegen & Laros (2004) who illustrate how certain items may be biased.
2. Differential Item Functioning: Study review.
I have purposely ignored a large amount of studies (mostly during the 1980s) that utilize flawed statistical procedures of DIF detection, such as, ANOVA, and Transformed Item Difficulty.
2.1. Understanding DIF.
Because DIF can be biased against one or the other group, the direction of bias is not systematic. But when it is, we call it cumulative DIF. This is important for group differences. For instance, when groups don’t differ in ability (e.g., men-women) cumulative DIF is not expected, because it would translate into group differences in total scores. In the absence of true group difference (or “group impact”) the presence of DIFs implies that the DIFs against women are counter-balanced by DIFs against men. It goes without saying that one should not disregard the presence of many large DIFs even if they are perfectly counterbalanced (DIF cancellation). A good test should better display DIFs of small size.
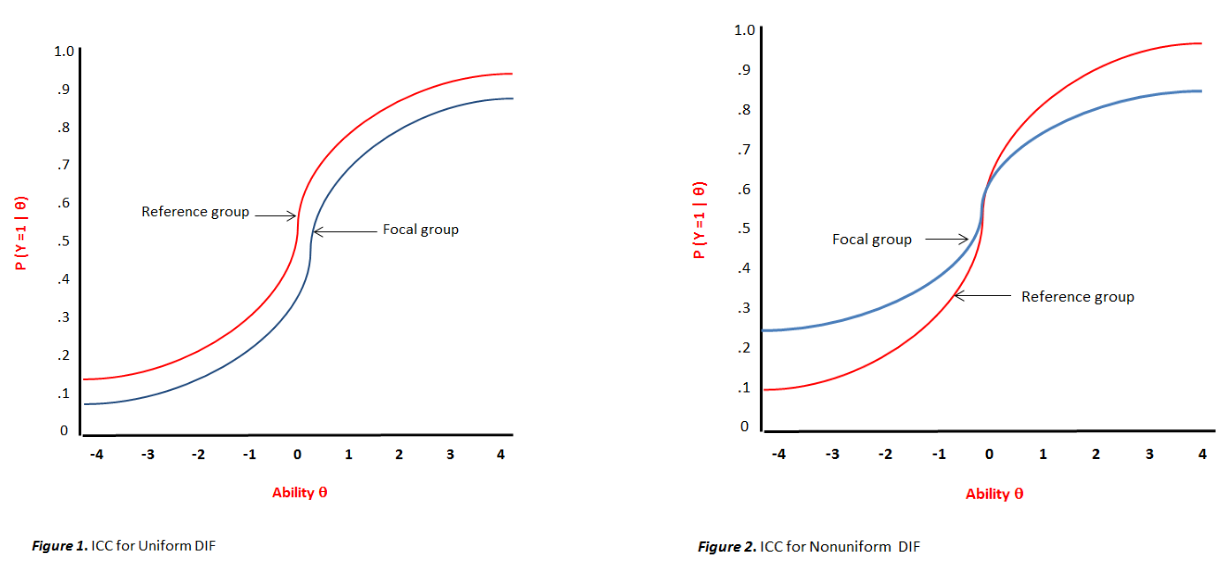
DIF can take on two forms. The uniform DIF which exhibits bias of same magnitude against one group across all levels of latent ability (θ). The non-uniform DIF which exhibits bias which varies in magnitude and sometimes in direction depending on levels of latent ability (θ).
The Presence of DIF indicates multidimensionality. Because when two groups matched with respect to the primary construct the test intends to measure, e.g., abstract reasoning for items of the Raven, the DIF signals nothing that the item is measuring secondary constructs (also called “nuisance” ability not intended to be measured, denoted η) that function differently from one group to another. This happens when a test is contamined by varying the levels of the other abilities. On the other hand, the existence of multidimensionality does not imply the presence of DIF or bias. In this case, it is simply called auxiliary (construct) ability.
The evidence of DIF using either ones of the statistical methods available does not mean there is no bias at the construct level. Because IRT-DIF is meant to detect bias at the item level and MGCFA is meant to detect bias at the subtest level along with relationship between latent constructs, both should complement each other. No bias among items does not imply no bias in latent relationship. For example, if one math subtest has a substantial loading on verbal factor among blacks but not among whites, it means that only blacks make use of verbal ability to resolve the questions on this math subtest, as if to suggest that blacks and whites use different strategies to resolve the cognitive tests, thus arriving at the same score but through different pathways.
Another causal path is related to the location of DIFs on the total range of difficulty. DIFs found either on easy or hard items certainly indicate different causes and lead to better understanding of this result.
2.2. Item test of racial bias.
Although Jensen (1980) has reviewed a considerable amount of test bias studies, the methods in use were generally far from being the most efficient. Notably the absence of IRT or even logistic regression analyses, and at subtest level no mention of MGCFA. Concerning DIF itself, Jensen (1980, p. 580) only cited two IRT-based studies. Jensen acknowledged that little information were provided by the authors of these studies but the conclusion was that racial bias is unlikely, regarding Verbal SAT (N=2250 for whites and N=2250 for blacks) from Lord (1976). More IRT-based studies is thus needed.
For instance, Drasgow (1987) analyzed a sample of 3000 examinees taking the (40-item) ACT-Math and a subsample composed of 1000 examinees taking the (75-item) ACT-English. Some items were found to be biased in both direction, either favoring minorities (e.g., blacks and hispanics) or the majority (i.e., whites) group, regarding significance tests. But χ²-based tests are useless if they are overly affected by N. What is of importance is the magnitude of the DIF. And even though a large amount of items shows “significant” DIFs, they were generally of very small magnitude, hence the conclusion that both the ACT-Math and ACT-English were not racially biased. Because of small biases in both directions, they tended to be cancelled out at the (overall) test level, so as to result in a relatively fair test. A cumulative DIF effect has been investigated by means of TCC, Test Characteristic Curve. The procedure involves the combination (i.e., the sum) of all individual Item Characteristic Curves (perhaps except poorly estimated items, due to large sampling variance) from the free model (i.e., no constrained parameters) in order to give an expected “number-right score” as a function of the latent trait. No cumulative DIF effects were detected. There was DIF cancellation.
Linn et al. (1981) compared the ICCs (within 3PL model) of groups of whites and blacks in a sample of ~2500 black and ~4200 white (5th grade) students (having income data) and ~2300 black and ~4100 white (6th grade) students (having income data) that took the Reading Comprehension section of Form F of the Metropolitan Achievement Tests, from the Anchor Test Study. They computed the group difference in ICC area, with 1° absolute difference, 2° base high area, 3° base low area, as well as, 4° the square root of the sum of squares. These four bias indices do not have high agreement in DIF detection. But overall, few items have been detected, but the DIFs, overall, tended to cancel out. On the within-race basis, ICC difference between income levels (high vs low) and between grade (5th vs 6th) is very negligible. Using roughly the same kinds of method, Shepard et al. (1984) reported an initial BW difference of 0.91 SD in the 29-item math test, in the High School and Beyond (HSB) data from the NCES, black N=1500, white N=1500, that has been reduced to 0.81 SD when the 7 items biased against blacks are removed. The found 0.81 SD gap probably under-estimates (although slightly) the BW difference because shortening the composite tests reduce reliability. Furthermore, this new composite is still not pure because they haven’t removed the 3 items that were biased against whites.
Similar conclusion has been reached by Willson et al. (1989) studying no less than 2932 items among the 10 subtests of the K-ABC. Only 23 items were biased against blacks whereas 13 items were biased against whites. When it comes to gender, 12 items were biased against males and 16 items against females. The procedure involves an item partial correlation between subgroups and item scores, with total score partialed out. This race-item partial correlation provides a direct, straightforward index of effect size. The problem is not that the N is small (N=100) but that they have based their study entirely on significance test. At the very least, they do conclude that “the effects, although statistically significant, tend to be of no real or practical consequence.” (p. 295). This method, in fact, has been proposed by Stricker (1982) who was testing DIFs between white males (N=1122) and females (N=1471) and black males (N=284) and females (N=626) on the 80-item Verbal GRE Aptitude Test. As expected, a large amount of significant DIF was detected for both gender and racial comparisons, but the partial correlations were small and evenly distributed in sign, i.e., DIFs in both directions, suggesting little bias. Employing the same method, Reynolds et al. (1984) analyzed the culturally loaded PPVT on a sample of 2100 children (85.4% whites, 9.6% blacks). Both the Form L (213 blacks, 1788 whites) and Form M (209 blacks, 1795 whites) have been provided to the same 2100 subjects. In Form L, 11 items favored whites and 3 items favored blacks among the 153 items. In Form M, one item favored whites and 3 items favored blacks among the 152 items. The magnitude of the correlations were very small. Unfortunately, the method can hardly detect non-uniform DIFs, and therefore could have been missed, although this would likely be inconsequential given the small number and size of these uniform DIFs because non-uniform DIFs occur rarely.
Using Stricker’s method, Valencia et al. (1995) studied the K-ABC Mental Processing Scales (MPS) and K-ABC Achievement for 100 white and 100 mexican american children. In addition to total score, they also partial out sex and age variables. Those two parts of the K-ABC, when combined, formed the Mental Processing Composite (MPC). Of the 120 items analyzed in MPS, with age, sex and MPC controlled, 17 were biased, with 13 against mexicans. All of these partial correlations were large in magnitude, varying from 0.14 to 0.28. Using the same control variables, they perform regression for each of the 8 K-ABC MPS subtests. One subtest is biased against whites (partial r=+0.07) whereas 6 other subtests have negative partial r that differ from zero, with an average partial r of about -0.10. Of the 92 items analyzed in K-ABC, with age, sex and the K-ABC Achievement total score controlled, 58 are biased, all against mexicans. The partial r ranged from a minimum of 0.14 to a maximum of 0.38, or 0.47 sometimes. Using the same control variables, they perform regression for each of the 5 K-ABC Achievement subtests. They are all biased against mexicans, with partial r as low as -0.02 and -0.03 to as high as -0.51. Two other subtests have partial r of -0.19 and -0.09. Either way we look at it, the bias in K-ABC Achievement is too high. The K-ABC MPS appears to be moderately biased, although there is no calculation of the cumulative DIFs to be certain of it.
The partial correlation method has also been used by Conoley (2003, Tables 4.1, 4.3) for a large sample (blacks, N=494, age=13.88; hispanics, N=352, age=12.98; whites, N=1753, age=19.07, ELL hispanics, N=300, age=7.20) taking the PPVT-III. Only children who speak and understand english were eligible. The black-white partial correlations were of modest size, between -0.09 and +0.09, on either PPVT-IIIA or PPVT-IIIB. The same pattern is observed for the hispanic-white comparison but this time the number of correlations favoring the minority group were clearly higher. Also, a very interesting finding has been noted by Conoley. In both black-white and hispanic-white comparisons, the DIFs against blacks and hispanics tended to occur at the beginning and especially at the end of the test. Concerning the English Language Learners (ELL) hispanics (only mexican descent) versus whites comparison, these correlations were widely dispersed with numerous large effects in both directions. There seems to be no consistent pattern that would show cumulative DIFs against ELL hispanics, nonetheless the IIIA form has large amount of small DIFs and low amount of large DIFs favoring ELL hispanics whereas there are relatively less small DIFs and more large DIFs favoring whites. Overall, IIIB form seems to be a fairer test. The absence of persistent bias is noteworthy given the large advantage in age for the white sample (but note that the SD of age within each sample is very large except for ELL). Finally, because it wasn’t reported, I have calculated the d gaps given Conoley’s data; BW=0.52, HW=0.30, BH=0.22. The score SDs were extremely large, averaging 56, 54, 57, given PPVT raw scores of 99, 111, 128 for the three ethnic groups in PPVT-IIIB but the gaps were of similar size with PPVT-IIIA. Regardless, this pattern of DIFs deserves explanation. For instance, Santelices & Wilson (2012, p. 7) and Scherbaum & Goldstein (2008, p. 539) explain that easy verbal items tend to be more culturally specific thus translating into differences in interpretation due to difference in kind of knowledge whereas difficult verbal items tend to involve rarely used words thus translating into differences due to difference in amount of knowledge. The usage and meaning of common words vary according to cultural groups. The usage of rare words do not vary much because they are very specific.
Restrepo et al. (2006) examined the PPVT-III (form A) and the Expressive Vocabulary Test (EVT) among 210 4-years-old high-risk children (121 blacks, 89 whites). All children selected english as their first language. Results from Rasch modeling (using WINSTEPS) reveal no bias against blacks in the PPVT-III, 3 items favored whites, 7 items favored blacks, among the 72 items tested for bias (items 13 through 84). They haven’t tested racial bias on the EVT but they report that EVT appears to be easier than PPVT-III for blacks. Concerning gender bias, they report no bias in the two tests. Their procedure seems to be entirely based on significance test (t statistic). Subsequently, Webb et al. (2008) use Mantel-Haenszel (MH) to study DIF on PPVT-III on the same set of data used by Restrepo. The items 25 through 48 are studied for DIF, with N=184 (due to missing data). One item is found to be DIF, and it favors blacks. However, in a Latent Class Analysis (LCA) they fitted a model with 2 Latent Classes which best describes the pattern of response and found that children of the lower-performing Class did use a strategy known as the novel name-nameless category (N3C) which may occur if the word is unknown to the child. While the N3C was the cause for the existence of these 2 Classes, the ANOVA’s partial eta squared (η²) revealed that racial groups were not related to these Classes.
Platt (2010) also examined the (168-items) PPVT-III to answer whether or not the language is plausible factor of DIF, on 129 children. Platt compares ELL groups and EL1 (english first language) groups, respectively, 59% and 41% of the sample, with MH method. They studied for DIF only the items 25 through 96, i.e., a total of 72 items. No large DIF was detected, only 1 item has moderate (uniform) DIF, and 6 items are small DIFs (and among those 6 items, 5 are just non-uniform). Those DIFs are not one-sided. As for the other items, however, they are not significant, either based on χ² or Breslow-Day (a χ² statistic for non-uniform DIF), so the author did not consider them as biased.
Nandakumar et al. (1993) use the Mantel-Haenszel (MH) to evaluate DIF among groups of white (N=836), black (N=110) and hispanic (N=116) children drawn from the 60-item GATSB standardization sample. The GATSB is a test measuring differential behaviors that would affect results obtained in the WISC-III standardization. They were 534 boys and 528 girls. The three analyses, one for each group comparison, i.e., black-white, hispanic-white, male-female), yield 10 DIFs, that exceed the cut-off value of Delta=1.50, out of the 180 possible instances of bias, 5 biased against whites, 3 against hispanics, 1 against blacks, and 1 against boys.
Some other research also reported absence of bias in white-black comparison of an english reading-comprehension test among students in South Africa (Meiring et al., 2005) using logistic regression procedures. The major weakness of that study is that they have stopped further investigation on the basis that the items show biases of little practical importance. But when individual small DIFs are summed, and if the direction of the DIFs is mainly one-sided, they can accumulate and create a meaningful impact at the overall test level. This possibility has not been considered. Anyway, if no bias were to be found, they speculate the reason lies behind the fact that a student sample necessarily reduces the between-group variability in the amount of school-related knowledge. The argument implies that school itself is the factor that produces measurement bias between races. However, measurement equivalence holds when rural (N=820) and urban (N=664) children had been studied in an adaptation of the Wechsler IQ battery (Guo et al., 2009). This finding suggests either that difference in the amount of schooling is not a particularly important source of measurement bias or that the Wechsler was a relatively fair test for groups differing in school-related knowledge.
Crane et al. (2004) used logistic regression to test DIF on the CASI test in a sample of 2646 Whites and 132 Blacks. Out of the 41 items, 2 were biased. They relied on p-value. So the magnitude or direction of bias is unknown, and detecting interaction effect (group*item) through p-value requires big sample.
Freedle & Kostin (1997) computed the DIF values for black (N=22452) and white (N=281991) examinees, using the STD P-DIF method, who had selected english as their best language, on the 217-item SAT verbal analogy. They found little evidence of bias against blacks. The same conclusion holds when they analyze the 234-item GRE verbal analogy, among blacks (N=1688) and whites (N=23375). They reported several studies showing that item difficulty correlates with the magnitude of DIFs. In Freedle & Kostin (1990) as well, blacks answered differentially better than whites for the difficult items but differentially worse for easy items on the verbal GRE and verbal SAT; both groups selected english as their best language. There seems to be a positive correlation between item difficulty and magnitude of DIF mostly around 0.50. But they argue the reason is likely due to black students making greater use of indirect induction strategy on the hardest items, maybe because these items are beyond their abilities, thereby giving them unfair advantage.
Dorans & Zeller (2004) criticized Freedle (2003) for failing to apply STD P-DIF appropriately. DIF analyses must have included correct and incorrect responses but also the non-responses. Given that different individuals omit their responses on different items, the sample of respondents used in the analyses for each item is different and therefore not comparable. Omissions are more likely on the harder items and thus more likely for blacks, although Scherbaum & Goldstein (2008, p. 551) study didn’t confirm it and that Kulick & Hu (1989) reported a similar pattern for white-hispanic and white-asian comparison while this phenomenon does not occur regarding gender differences. Unlike the found correlation between DIF and item difficulty of 0.50 in Freedle’s study, Dorans found only a modest correlation, about ~0.20. Other criticisms (reviewed by, Scherbaum & Goldstein, 2008) against Freedle involve the fact he used old versions of SAT and GRE tests while in fact their newest versions have been screened for DIFs in order to make them fair(er) for minority groups. It has also been argued that, despite such correlation, DIF size on any given item is usually small. Wainer and Skorupski (2005) performed a simulation of SAT data where no DIF is present but where blacks score 1 SD lower than whites. But low-IQ whites become more advantaged when difficulty decreases whereas low-IQ blacks become more advantaged when difficulty increases. They argue that if two individuals have the same score and one of the individuals correctly answers more of the hard items, the other individual must correctly answer more of the easy items. Therefore, they note that this pattern must occur when individuals are matched on the total test score for the DIF analyses; thus, the Freedle effect is merely a statistical artifact. This finding is curious because Scherbaum & Goldstein (2008, pp. 548-549) failed to replicate it.
But the existence of this correlation has been replicated so many times on the newer data, generally by means of STD P-DIF, as to be the subject of investigation from Santelices & Wilson (2012) who strongly confirmed black over-performance against whites on hard items (and conversely on easy items) regarding the verbal SAT. They use IRT to show that this relationship was not a result of statistical artifact, such as random guessing not well accounted for in STD P-DIF method, because it still exists in the IRT 3PL model that corrects for guessing. Furthermore, the guessing or c-parameter was not correlated with item difficulty. Such result counters Freedle’s argument that black people will tend to guess more on difficult questions because they are beyond their abilities. Such findings also invalidate criticisms against STD P-DIF and other methods based on observed total score matching, initially thought as being responsible for the empirical correlation between item difficulty and DIF. Scherbaum & Goldstein (2008, Tables 1 & 2) come to similar conclusion. They use STD P-DIF and IRT 2PL model (since the 3PL didn’t fit well) to estimate, for each of the 11 items of the civics knowledge achievement test between, blacks (N=427) and whites (N=1701), the magnitude and direction of DIF as well as the difficulty parameter in IRT or the p-value (passing rates) in STD P-DIF. The results showed DIF cancellation. Then, the procedure becomes simple and straightforward. They just correlate the two vectors. The results were similar for both methods, suggesting the criticisms against STD P-DIF were not well founded. The strong correlation between DIF size and difficulty may not be an artifact, at least when verbal tests (e.g., SAT/ACT/GRE) are involved. Because when SAT and GRE-math were examined, this correlation was very small.
Ironson & Subkoviak (1979, p. 218) also discovered in samples of whites (N=1794) and blacks (N=1691), notably using IRT approach, that biased items tended to be high at the end of the subtests (mostly verbal content). The bias runs against blacks however. Perhaps due to difference in levels of reading ability (i.e., difficulty too high for one specific group) or perhaps lack, difference of speed in completing the test. The number of items completed by subjects seems not be reported in many instances but if unanswered items are treated as wrong answers, then group difference in response rates can emerge and falsely create biases.
Does it mean that increased time allotted on test scores would reduce the racial gap ? There seems no evidence of this. Wild et al. (1982) examined samples blacks and whites taking the GRE (both quantitative and verbal). But differential timing had no effect on the scores. They suspect one possibility is that high-IQ people use the extra time to review their answers. It seems indeed that these corrections produce some score gains. But another and simpler explanation is that harder items appearing at the end of a test have difficulty levels that exceed the limit of low-IQ people, no matter how many time they are allowed to use. Bridgeman et al. (2003) replicated this study on a much larger sample of blacks, asians, american indians, hispanics, whites taking the computer-adaptive GRE (quantitative and verbal). Neither women nor minorities perform differentially under different time conditions.
Schmitt & Dorans (1990) used the standardization method, DSTD, to study DIF. The SAT verbal displayed few DIFs and among those DIFs, both forms (3H and 4H) were biased in favor of mexicans compared to whites whereas the 3H (and 4H) displayed small bias against (and moderate bias in favor of) blacks. Their analysis also shows that minorities (blacks, hispanics, and to a lesser extent asians) had differential speededness. For example, the last items of the verbal SAT analogy have been reached more often by whites. This has been an important question worth studying because when those last, hardest, items not reached by blacks were removed from the analyses, just only a few DIFs remain. So it appeared that much of the black-white DIFs was due to differential speededness. Finally, their review of a series of extremely large sampled studies on the SAT-verbal and SAT-math for asians, blacks, whites and hispanics points to a general pattern of no (or few) large DIFs when the subjects, especially the asians, speak english as their best (spoken) language. An interesting finding is that the number of DIFs found even on the SAT-math is substantially greater when the subjects did not select english as their best language. Similar views are held by He & Wolfe (2010). Thus, controlling for language can ultimately remove the distorting effects due to language-related DIFs.
The importance of language bias receives even more support from te Nijenhuis et al. (2004, Table 7) and Wicherts & Dolan (2010) using respectively MH and MGCFA procedures on the same sample of dutch children (whites vs. immigrants). The most substantial biases occur on the verbal subtests, e.g. Learning Names (LN), in the RAKIT battery, underestimating Moroccans and Turks IQ by 0.22 and 0.17 SD respectively, i.e., more or less 3 IQ points due solely to the LN subtest, according to te Nijenhuis, whereas Wicherts & Dolan argue for a 7 IQ points underestimation in the total immigrant group for the totality of the biased subtests. But Wicherts & Dolan mischaracterized te Nijenhuis et al. (2004) study by claiming that they have greatly underestimated the magnitude of bias. In fact, the 3-points underestimation was due solely to LN, not the totality of the biased subtests. Therefore, given te Nijenhuis data, I have calculated the cumulated d gaps by multiplying the sum of d’s by 15 which gives an underestimation of 6.75, 8.85, and 9.75 IQ points for, respectively, surinamese or netherlands antilleans (N=183), turks (N=194), moroccans (N=182), compared to dutch whites (N=604). Even this large gap can be thought as lower-bound because te Nijenhuis noted he hasn’t studied all the available, possible items and that an even larger DIF amplification may be expected. As for the cause, it has been considered that some items/subtests (e.g., LN) contain fairy tales that may be unfamiliar to those immigrant children. te Nijenhuis & van der Flier (1997) also use the MH on a sample of surinamese (N=535), antillians (N=126), north africans (N=167), turks (N=275), and white dutch (N=806) living in Netherlands. The test was the GATB, with only 3 (out of 8) studied subtests. The cumulated effect size (DIF) against these immigrant groups are, respectively, 0.09, 0.09, 0.19, 0.12. The amount of bias is suspected to be stronger than this because some other subtests are not analyzed; the immigrant groups did not completed a sufficient number of items, te Nijenhuis put his acceptable minimum at 10. This problem may result from to the fact that the entire test is timed. Using the same set of data, and with another from South Africa (black-white comparison), Dolan et al. (2004) studied psychometric bias at the subtest level using MGCFA and established violation of measurement equivalence, and noted that the previous authors having analyzed these two samples indicated there seemed to be some language biases. Dolan’s analysis of the Dutch sample suffers from having fitted MGCFA to all 5 groups simultaneously rather than pairwise group. Overall, these findings can be compared with that of Richwine (2009, pp. 50-54), using SIBTEST procedure, who failed to find DIF amplification underestimating the ability of US immigrants (N=706), mostly mexicans/hispanics, versus native US whites (N=2837) on the 100-item PIAT-math in the NLSY97. One may be tempted to guess that the difference could be explained by the lack of strong cultural knowledge in mathematical test items.
Scheuneman & Gerritz (1990) also used the Mantel-Haenszel (MH) and found DIFs in the verbal section of the SAT and the GRE in black-white and gender comparisons. Unfortunately, these authors never reported the sample sizes for any of the groups/subgroups. Although they found evidence of a substantial cumulative DIF effects by summing the individual R-squared values, there is no information on their true impact on the test total score. Regardless, the authors speculate that an important source of bias was past knowledge due to choices of courses differing among the students, e.g., literature courses (more females than males) which would give unfair advantage in narrative content for females. One would think that test contents closely related to what is taught in school can potentially create cumulative DIFs against the disadvantaged groups when those groups differ in school-related knowledge. If so, these cumulative DIFs against blacks can be explained by group difference in amount of reading.
Using MH, Ryan & Bachman (1992, Tables 4 & 5) evaluated DIFs in two English as a Foreign Language (EFL) proficiency tests, the TOEFL and FCE, between males (N=575) and females (N=851), and between indo-europeans (IE, N=792) and non indo-europeans (NIE, N=632, specifically composed of groups of arabs and asians). In the gender analysis, only a very few items exhibit moderate and large DIFs. Most of the DIFs were of small size. In the IE/NIE analysis, for TOEFL, there was a large number of moderate/large DIFs but there was an equal number of DIFs favoring the focal group and favoring the reference group. With regard to FCE, there are more large DIFs that favor IE (8 vs 3) while there are more modest DIFs that favor NIE (9 vs 5); in the end, we are left with the impression that FCE can be modestly biased against NIE. The authors noted the following, nonetheless, “we need to recognize that native language in this study is most likely a surrogate for a complex of cultural, societal and educational differences”. The limitation of the analysis is that the impact of DIFs (i.e., DIF amplification or cancellation) on the total score has not been investigated, only the number of DIF in one direction or the other. So, the DIF cancellation they found was only suggestive. This criticism against Ryan & Bachman has been advanced by Kim (2001) who found a somewhat different result in a speaking test (composed of grammar, pronunciation and fluency tests), using IRT and ordinal LR. At low ability levels, the bias favors european groups (N=571) over asian groups (N=467) but this biased-advantage tended to become minimal at high levels of ability.
Gibson (1998) conducted an ambitious IRT study on the items of each of the ASVAB subtests, comparing gender (male/female) and races (whites/hispanics/blacks) which means 6 subgroups in total. The biases were large in magnitude. Nonetheless, Gibson noted that the bias varied greatly depending on the forms and versions of ASVAB subtests. Some Forms were biased while some weren’t. Interestingly, Word Knowledge and Mathematics Knowledge seemed to be free from DIFs. Also, Coding Speed was the least biased among all subtests and has easily passed the DIF test. Electronics Information behaved quite curiously because it performed fairly well for 5 subgroups except for black women for whom the IQ was under-estimated. The remaining 6 subtests showed inconsistencies in their biases, depending on the Forms (e.g., 15A, 15B, …). The impact of overall DIFs on the racial differences in the total composite score is not reported or even tested. Yet more often it seems the various forms were biased in favor of blacks and sometimes against whites. In any case, one is left with the idea that ASVAB probably needs to be rethought.
Tellegen & Laros (2004, Tables 5 & 6) examined a sample of 83 brazilian (from Brasilia) and 51 dutch children (from Netherlands) that took the SON-R test. Only 3 subtests were examined (those suspected to be most culturally loaded) : Categories (27 items), Situations (33 items), Stories (20 items). They use IRT, and they proceed in two step. First, evaluate which IRT model has the best fit to the data and it turns out to be a model with fixed c-parameter (i.e., the guessing) or 3PL for Categories and Situations whereas the 2PL obtained the best model fit for Stories. Second, they evaluate whether the DIF model (with group difference in b-parameter) has better fit than the non-DIF model. Based on -2LL, DIF model shows better fit. Among a total of 80 items, 19 were identified as DIFs, 11 favoring brazilians and 8 favoring the dutchs. Given the similarity in magnitude of the difference in the b-parameter (difficulty) that favors one group or the other, among all these 19 DIFs, it seems there is no systematic bias against the brazilians.
Evidence of DIF should not be necessarily interpreted as to say there is evidence of bias. DIF is a necessary but not sufficient condition of bias, as Roznowski & Reith (1999) cogently noted. These authors analyzed cognitive tests, vocabulary, basic arithmetic, geometry & algebra, science, writing, civics, for a total of 125 items, from the High School and Beyond (HSB) data, between whites (N=1301) and blacks (N=264) but also between gender groups. They use the MH procedure, with common odds ratio (ά) to estimate effect sizes. The proportion of DIFs was high. Overall, only 78 items were unbiased in the race analysis, and only 85 were unbiased in the gender analysis. After identification of biased items, different composites were created. Some composite total score containing items both unbiased and 1) biased against either males or females, 2) or biased against either blacks or whites, 3) or biased only against males, 4) or only against females, 5) or only against whites, 6) or only against blacks. And finally another composite with only unbiased items. They follow this procedure for the moderate biased items condition and then for the strongly biased items condition, so in total they create 13 composite scores (1+6+6) with 6 moderately biased composites and 6 other strongly biased composites. They establish (Tables 3 & 4) the equivalence of all these composite scores, meaning that unbiased and biased composites do not differ meaningfully. Furthermore, each of these composite do not even differ largely in their predictive validities, e.g., regression on either SAT-M, SAT-V, SAT-composite, ACT, or high school rank percentile. Finally, they tested the regression intercepts to evaluate the (biased) mean differences but the direction of the intercept difference was inconsistent. The best recommendation would be to detect the biases and compute the difference between the old and the new (purified) composite test score. Given their demonstration, there should be no doubt that even a large bunch of biased items does not automatically cause poor(er) measurement. Item bias is not equivalent to test bias. While some DIF researchers understand this principle, most MGCFA researchers do not understand this.
2.3. Item test of gender bias.
There are many more studies on gender bias but because this is practically of much less importance than racial bias, only few studies (among those important) are considered here.
With regard to gender DIF, Chiesi et al. (2012) by means of IRT modeling come to the conclusion that the short form of the APM (i.e., 12-item Raven matrices) was not age- or gender-biased (N=1956). They took another but smaller group of europeans and established measurement equivalence at the between-country level. Similarly, Abad et al. (2004) use the 30-item APM with N=1970 and they ensured that the test was of one-dimensional nature. Then, whereas they expected APM to be favorably biased towards males due to the fact that the test is based on abstract figures and that men have higher spatial ability than females, the deletion of large DIFs (detected with RMSD) only reduces the gender gap from 4.06 to 3.32 IQ points, or rather, from 4.53 to 3.96 when corrected for unreliability. From the socialization theory, this small IQ reduction may be explained by gender difference in cultural exposure related to visuo-spatiality that gives an undue advantage for men. The remaining IQ gap would be explained by other factors.
However, the widely used WISC-III seems to contain 52 biased items among the 151 items studied in a male-female (N=2200) group comparison (Maller, 2001). Six subtests (seemingly the most culture-loaded ones) were analyzed: Information, Similarities, Vocabulary, Comprehension, Arithmetic, Picture Completion. The procedure was an IRT approach and the effect size is approximated by the RMSD. The subtests often show a bias of one-point difference due to DIF. Overall, the impact of DIFs tended to cancel each other out so that there was no systematic gender-biased differences on average among all of the subtests. Nonetheless, Maller added “This argument is also refuted because the presence of even a one-point systematic raw score difference on individual subtests due to gender-related factors may result in systematic age-based standard score differences at the subtest level and may have cumulative effects at the scale score level for individuals.” (p. 814). Perhaps the cause of bias is related to cultural loaded items. For these items, socialization might matter. Maller cited several studies in this matter which conclude that “gender content bias in items that exhibited DIF in favor of females has been linked to specific topics involving humanities, aesthetics, and human relationships, whereas items that exhibited DIF in favor of males have been linked to content about science, sports, and mechanics” (p. 795). In parallel, Pae (2004, Table 3) provided mixed evidence for socialization theory. In an administration of an english (sub)test in two asian groups, one taking courses on Humanities (social sciences) and the other taking courses on Sciences (hard sciences), one group appears to be favored by some items and the other group to be favored by some other items. Although the cumulative DIF is small and not systematic across all levels of the latent ability, the authors warns about the possibility of a larger cumulative DIF at the test level, i.e., the combination of all the subtests, which includes the subtests other than the verbal one. However, such hypothesis is implausible unless the composite test was very unbalanced in test content so as to constantly favor one group much more than the other. The same thing could be said about Maller’s comment. We simply cannot expect one-sided cumulative gender DIF-effect unless we suspect the other (omitted) subtests to be one-sidedly biased. Especially when the combination of 6 subtests among the 13 subtests belonging to the WISC-III shows no cumulative effect, there should be no reason why the 7 others must be one-sidedly biased and, more importantly, Maller does not provide any reason for this to happen. Maller offers no convincing criticism of the WISC-III regarding gender-fairness.
Immekus & Maller (2009) evaluate gender DIF on the Kaufman Adolescent and Adult Intelligence Test (KAIT) by means of IRT. Sample size was 2000 and age ranges between 11 and 85+. As usual, when DIFs are detected, they were mostly of uniform kind. Among the 176 items analyzed, 42 were biased but only 13 items have large DIFs. Overall, their impact on the total score tended to be inconsequential. Noteworthy is the fact that all DIFs fall within the crystallized subtests with no DIF in the fluid subtests. This very fact, if generalizable, would weaken Maller’s (2001, p. 814) assertion even more.
Nandakumar (1993) found, with MH and SIBTEST, some evidence of gender bias against females on the 60-item ACT math (males=2115, females=2885) and 36-item NAEP 1986 history test (males=1225, females=1215). On the ACT, some items favored males, some others females. On the test level, there has been partial DIF cancellation, with a large Differential Test Functioning (i.e., the sum of DIFs) bias against females (βU=.294). Items favoring males generally require some sort of analytical/geometry knowledge, such as, properties of triangles and trapezoids, angles in a circle, and volume of a box. On the NAEP history however, there was no evidence of DTF with a very weak βU=.018. Items favoring males mainly involved factual knowledge, such as, location of different countries on the world map, dates of certain historical events, whereas items favoring females involved reasoning ability about the constitution or entrance to the League of Nations. Nandakumar also examine the 36-item NAEP 1986 history test on 1711 whites and 447 blacks, and although the DTF effect size is not reported, the number as well as magnitude of DIFs favoring whites is much larger than those favoring blacks. There seems to be a very strong bias against blacks. The items favoring whites required some geographical knowledge and facts about World War 2, which is a perfect illustration of the differences in exposure to knowledge.
An explanation as for the cause of gender DIF involves differential interest or motivation in the test content, for instance, on psychology test (Stricker & Emmerich, 1999) and english test (Pae, 2012). Both studies found that magnitude of (uniform) DIF was correlated with the magnitude of gender difference in interest on the test item. According to Stricker & Emmerich, their own result was surprising because “the items came from an operational test and hence had been screened for gender fairness as part of the test construction process” (p. 361).
2.4. Latent Class Analysis.
This novel technique is becoming widely used and involves grouping individuals by classes based on who respond similarly to a set of observed items. These classes are hidden or unobserved subgroups that characterize heterogeneity within a population with respect to a given phenomenon. Deciding on the number of classes (class enumeration) is done first by fitting 1-class model, which estimates item endorsement probability, then by increasing the number of classes by 1 until there is no improvement in model fit or when convergence issues happen (e.g., identification problems or overparameterization).
So far, only few studies applied this method for test bias between races (Webb et al., 2008; Hinton, 2015). Because Hinton’s study was much more ambitious, I am going to review it here. The tests used were the Raven’s SPM and APM. Sample for SPM is composed of 441 whites, 24 blacks, 172 Middle Eastern, 269 Asians, with a total of 612 non-whites. Sample for APM is composed of 1197 whites, 18 blacks, 18 Middle Eastern, 238 Asians, with a total of 310 non-whites. In both cases, the Asian group was overly inclusive (Chinese, Indian, Pakistani, Bangladeshi, etc.). DIF was assessed with logistic regression. Some items displayed DIF, but of small magnitude. DTF (or TCC) also displayed negligible difference between whites and non-whites, whites and Asians, whites and Middle Eastern groups.
Before applying LCA, a factor analysis is performed to detect the number of underlying factors through a parallel analysis based on tetrachoric correlations. The suggestion of 2 factors (for either APM or SPM) violates the unidimensionality assumption of LCA. This seems to be annoying as the Raven is supposed to measure only one ability, abstract reasoning. Hinton however noticed a pattern in both APM and SPM. The latter items of these tests all load strongly onto the second underlying factor. After reviewing several studies on this subject, Hinton (2015, pp. 137-138) arrived at the conclusion that Raven did in fact measure two abilities: visuospatial ability (during earlier items in the test) and verbal-analytic reasoning (toward the end of the test items). This is consistent with the two underlying factors suggested by the parallel analysis.
The number of latent classes was decided based on the entropy statistic. A 2-class and 4-class models seem to fit best, but when they were compared, the 4-class model exhibited very large loadings and intercepts in the last Class, suggesting statistical artefact instead of subpopulation. The 2-class model was therefore retained.
Using first the SPM, bias was determined based on Sawatzsky et al.’s (2012) suggestion to plot the TCC for each class and compare them to that of the one-class model. The ICCs (before summed into TCC) were calculated based on Oliveri et al.’s (2012) procedure. The TCCs displayed large bias (Figure 17) consistently favoring Class 1 over Class 2. To investigate whether such DTF is related to ethnicity, two methods were used. First, examine the percentage of ethnic groups for each Class. Because most ethnic groups have equivalent proportions within each latent class, ethnicity has no relationship with latent class membership. Second, latent class was used as dependent variable in a logistic regression with ethnic group as independent variables. None of these dummy ethnic variables was related to latent group classification.
Using the APM, the same analysis was repeated. No bias from either ICC or TCC. Factor analysis once more suggested 2 underlying factors. Class enumeration procedure was much clearer here than with the SPM, suggesting a 3-class model. The TCCs displayed large bias (Figure 21) uniformly favoring Class 2 over Class 1 while Class 3 becomes more disadvantaged as the level of latent ability (θ) increases. Ethnicity percentages were once again broken down and multinomial logistic regression (since the dependent variable now has more than 2 groups) performed to predict latent class. Both methods reveal that ethnicity is not related with DTF.
An interesting pattern is observed in both SPM and APM. In SPM, Class 1 had better odds of responding to the earlier items while Class 2 had better odds of responding to the later items. In SPM, Class 1 performs better on later items while Class 2 performs better on earlier items. This suggests that Class 1 and 2 are associated either with visuospatial ability or verbal-analytic reasoning, as discussed above. If true, that means Class 3 in the APM data could be a spurious latent class due to its origins not being identified. This illustrates why theoretically-driven model has to be given more weight than data-driven model. Class-2 model makes more sense despite fitting worse than Class-3 model.
This entire procedure looks rather promising but is obviously more time consuming and complex than the traditional DIF methods. A major issue with LCA is the labelling/naming of the latent classes. It is no easy task to identify the nature of these classes. One way to identify these classes is to enter different independent variables in a logistic regression and see if they strongly predict class membership.
3. Multi-Group Confirmatory Factor Analysis: Study review.
3.1. Introducing MGCFA.
For the subtest-level analysis, MGCFA is the gold standard method. It proceeds by adding additional constraints to the initial, free model. The model parameters are constrained to be the same across groups. The following steps are taken: first, constrain the factor structure (configural invariance), second, constrain the factor loadings (weak/metric invariance), third, constrain the intercepts (strong/scalar invariance), fourth, constrain the residuals (strict invariance). Since the last equality constraint is sometimes dropped due to confoundings between measurement errors and specific variance (Dolan & Hamaker, 2001, p. 15), strict invariance seems not to be a condition for establishing measurement invariance. If the model fit shows a meaningful decrement throughout one of the steps, invariance is rejected.
Exploratory analysis must be conducted first to select the model structure to be fitted. But it is often argued, and with good reason, that model selection should be based on theory first. A structure which makes no sense must not be selected even if it fits the data better.
Fit indices such as CFI, TLI, RMSEA, SRMR, ECVI are used to retain or reject models. Chen (2007) simulated different conditions, among first-order factor models, one of which involving small sample size and unequal sample size. A commonly encountered situation. The recommended cutoff then is ΔCFI=>0.005 and ΔRMSEA=>0.010 for all 3 levels of invariance tests whereas SRMR=>0.025 and SRMR=>0.005 for loading invariance and intercept/residual invariance, respectively. Meade et al. (2008) also simulated first-order factor models by varying the number of biased items and sample size but recommended only 2 fit indices to assess invariance: ΔCFI with =>0.002 cutoff for loading and intercept invariance and ΔMc with varying cutoffs depending on the number of items and factors (Table 12). Since the best structure of intelligence involves a second-order factor either from a hierarchical or a bifactor model, these cutoffs may not hold well. Khojasteh & Lo (2015) investigated the sensitivity of fit indices in a bifactor model and concluded that only ΔGamma and ΔCFI should be used for testing loading (also called metric) invariance, with these respective cutoffs: ΔGamma = -0.016/-0.023 and ΔCFI = -0.003/-0.004.
3.2. Traditional method.
The first analysis of invariance between black and white groups came from Dolan (2000) and Dolan & Hamaker (2001) through a modeling of a higher-order g factor, as it best approximates the structure of intelligence. No bias was detected in both the WISC-R and K-ABC but the g-model of weak Spearman’s Hypothesis (SH) fitted equally well with the non-g model. Frisby & Beaujean (2015) fitted a Bifactor model, which they believe has some advantages over a higher-order factor (HOF) model, and reported that g was measured without bias between black and white groups in the WAIS-IV/WMS/IV standardization data but also that weak SH model has better fit than non-g model.
More recent studies employed MGCFA and also tested SH. One such analysis on the WJ-I, WJ-R and WJ-III standardization data established measurement invariance between blacks and whites but could not evaluate the likelihood of the two g models of SH against the non-g model regardless of HOF or Bifactor models (Hu, 2017), reaching a conclusion similar to Dolan. In the VES and NLSY79 data, and for both the black-white and hispanic-white group analyses, fitting a Bifactor model for MGCFA confirmed the invariance and showed that the weak version of SH had better fit than the non-g model (Lasker et al., 2021). Similar conclusion was found for the NLSY97 when comparing black and white groups after fitting a Bifactor (Hu et al., 2019). In other data, Lasker et al. (2019-Supplementary) once again fitted the Bifactor model and established invariance for the NIH test battery in the black-white and hispanic-white groups but failed to establish invariance for the PCNB in the black-white group (and borderline in the hispanic-white group) at the scalar level of invariance. They did not report whether some of these PCNB subtests were biased against whites or the ethnic minorities. In both datasets, the contra SH model was consistently rejected. The other studies discussed below did not test SH against the non-g model.
Sipe (2005) analyzed the pattern of black-white bias on the SIENA Reading Component Process Test designed to measure 4 subscales related to reading comprehension: Knowledge Access, Knowledge Integration, Text Inferencing, Text Memory. Total N was 430. Compared to a traditional reading test that is meant to capture the overall construct of reading comprehension, the SIENA taps the antecedent cognitive processes associated with reading and therefore requires less background knowledge. Few items on both the SIENA and traditional test exhibited group DIF and were removed. Applying MGCFA to test the factor loadings of the remaining items on their respective subscales show no group difference. But on the traditional reading test, loading invariance was not supported. A final CFA firstly for the SIENA (two-factor model) and secondly the traditional test (single-factor model) was conducted to test for factor structure. They both show very good fit. While the SIENA exhibited moderately lower BW differences than the traditional test, the least culturally loaded subscales of the SIENA, namely, the two Text subscales showed larger BW differences (Table 6). Knowledge Access was strongly biased against whites.
Scheiber (2015) applied the CHC model, a well accepted structure, to the Kaufman entire battery composed of intelligence (KABC-II) and achievement tests (KTEA-II). This results in a second-order g with 7 first-order factors. There were 1313 whites, 312 blacks and 376 hispanics. The black-white analysis showed metric and intercept invariance while the hispanic-white analysis showed a small intercept bias with ΔCFI=0.007 (Tables 10-11).
Scheiber (2016) examined the CHC structure of the WISC-V between 777/830 white males/females, 188/221 black males/females, and 308/313 hispanic males/females. Unfortunately, MGCFA with second-order g was applied for all these groups simultaneously and not for a pairwise group comparison. In Table 3, it is shown that intercept invariance at the subtest level is violated (ΔCFI=0.02 and total ΔRMSEA=0.017). The way MGCFA is applied is anything but informative. A sloppy analysis.
Trundt et al. (2018) applied MGCFA to the DAS-II battery on a sample of 2270 children, of which 407 were blacks, 98 were Asians, 432 were hispanics. Invariance was tenable for all pairwise group comparisons, except a small bias at the intercept level for black-white comparison (with a 3-point bias in favor of blacks in the only one biased subtest) and hispanic-white comparison. While the result is satisfying, it tells nothing about the Spearman’s Hypothesis (e.g., whether it is an unbiased measure of g) because they considered a correlated factor model, without g.
Benson et al. (2020) applied MGCFA to the Universal Nonverbal Intelligence Test–Second Edition (UNIT2) using data from a norming sample of 1802 individuals aged 5 to 21, and of which 76% were white, 15% were African, 4.5% were Asian or Pacific Islanders, 20% were hispanic. Because the Bifactor structure had better fit to the data in a comparison of CFA models, it was selected for MGCFA. A comparison by either race (multi-group) or ethnicity (hispanic vs. non-hispanic) reveals that scalar invariance was violated in both the race and ethnicity variables. Subtests, as shown by their mean intercept, tend to be more difficult for blacks (bias of 10 points but ambiguous estimate due to a slight non-invariance in factor loadings) and hispanics (bias of 4 points). However, it was not just a race-ethnicity issue, because invariance was also violated for gender and age groups. Furthermore, with only 6 subtests and undersampling of the diversity of cognitive abilities, the UNIT2 wasn’t a good enough battery to begin with. Finally, the group comparison should have been conducted in a pairwise fashion instead.
Cockroft et al. (2015) analyzed the WAIS-III in a sample of South African students of low SES with an English second language and British White students of higher SES with English as first language. All levels of invariance (including configural) were violated. They oddly use the Kaiser-Guttman Eigenvalue to determine the number of factors, a method that is not the best. Their procedure was also expeditive. Lasker (2021) criticized their analysis on several levels. For one, the Kaiser-Guttman criterion estimates need to be reported with CIs, which were found to be large when Lasker computed them. Yet another, subtest bias must be further examined to understand its magnitude and direction. Lasker found that the subtests were mostly biased against whites. If South African (British) configuration model is used, then 80% (67%) of the subtests were biased in favor of the South African group. But Lasker also confirmed that metric invariance was violated. Therefore, while it is correct to state that Cockroft et al. stopped their analysis prematurely, it must be reminded that computing estimates of subtest bias serves only as an illustration here because factor loading non-invariance implies we are comparing apples and oranges.
Hajovsky & Chesnut (2022) analyzed the WJ-IV in a norming sample. Fitting the CHC model on the WJ-IV Cognitive battery and a first-order four latent factor model on the WJ-IV Achievement battery reveals that both batteries were measurement invariant across racial groups and also across ethnic (i.e., hispanic vs. non-hispanic) groups. Interestingly, the establishment of invariance along with group differences in latent means resulted in differential predictive relations. A phenomenon known as the Kelley’s paradox, discussed thoroughly by Borsboom et al. (2008), Heesen & Romeijn (2022) and Dalliard.
3.3. Alignment method.
Because MGCFA is not practical with many groups (>2) due to poor model fit of the scalar model and too many large modification indices, Muthén & Asparouhov (2014) proposed the Alignment method.
Odell et al. (2021) examined the PISA scores on mathematics and science scales as well as the more recent PISA ICT scales which have the peculiarity of being self-reported skills. Measurement invariance was assessed using a novel technique called the alignment method, which is based on maximum likelihood or Bayes estimation and can be performed with either free or fixed estimation. As Odell et al. explain:
Alignment minimizes the amount of measurement non-invariance by estimating the factor means and variances and it identifies parameters without imposing scalar invariance. Different restrictions are imposed that optimize a simplicity function (Muthén & Asparouhov, 2014). The simplicity function is optimized at a few large non-invariant parameters and many approximately invariant parameters rather than many medium sized non-invariant parameters.
There are two steps that occur automatically during the Alignment analysis. The first is an estimation of a configural model, where loadings and intercepts estimated freely, factor means are fixed at 0, factor variances are fixed at one, while factor loadings and intercepts are freely estimated. In the end, the final Alignment model will have the same fit as this configural model. The second step is Alignment optimization, where factor means and variances are assigned values based on a pattern of parameter estimates using a simplicity function to minimize the total amount of non-invariance for every pair of groups and every intercept and loading using a simplicity function similar to rotations in an exploratory factor analysis (EFA). The estimation stops when the least amount of non-invariant parameters is achieved.
For the ICT scales, the amount of non-invariance is very high, with 68.60% and 34.8% for intercepts and factor loadings. For the PISA math scales, the average amount of non-invariance is 9.40% and 6.0% for intercepts and factor loadings. For the PISA science scales, the amount of non-invariance is 0.83% and 1.0% for intercepts and factor loadings. These are well below the recommended 25% cutoff. Therefore, only the factor means of the ICT violate invariance across countries. The authors however suggest that invariance should also be tested between subgroups: “Alternatively, if the countries were organized into subgroups based on their similar cultural involvement with technology, then the PISA representation of ICT may become measurement invariant.”
While promising, this method is not an improvement over the traditional MGCFA as it does not allow complex modeling which would implement, for instance, cross loadings, covariates, second-order latent factor or bi-factor. These limitations restrict the Alignment method almost to an exploratory tool.
4. Discussion.
As long as IQ tests, instead of reaction-inspection time tests, are used to assess group differences in ability, a degree of culture load no matter how small is necessarily involved. Yet as most studies revealed, cultural bias is often not implied. The most well established, recognized IQ tests can be used across culturally diverse groups living in developed countries. Despite this, IQ testing will continue to be challenged.
One such attempt is from Fagan & Holland (2002). They designed a cognitive test using novel words, on which the black-white gap vanished in their small sample experimentation. This leads them to conclude that traditional IQ tests measure nothing else than knowledge. Not only inspection time tests (Pesta & Poznanski, 2008), backward digit span tests (Jensen & Figueroa, 1975; Dalliard, 2013), and measurement invariance cast doubt on their assumption, but their culture-fair test did not actually measure intelligence. Their students were trained on the meaning of these novel words (p. 365). The description is clearly that of a short-term memory test, which exhibits small black-white gap but also a black advantage when IQ is held constant (Jensen & Reynolds, 1982; Reynolds & Jensen, 1983). And there is more. Not only their students were given several times the instruction to fill in everything through guessing, they were given several times the instruction to answer as quickly as possible (p. 367). The latter aspect bears similarity with the Coding (speeded) subtest of the ASVAB. But speeded subtests have the lowest correlation with g or reaction time (Jensen, 1980, p. 590, fn. 8; 1998, pp. 204, 224, 236; Coyle & Pillow, 2008, Fig. 2). Decades ago, Jensen (1980, ch. 14) reviewed similarly flawed attempts at designing a culture-free test to make the black-white gap vanish.
Therefore, research on test bias is not only useful for disconfirming the cultural hypothesis but also for vindicating the Spearman’s Hypothesis. Not only for the purpose of valid cross-group comparison when testing SH but also for estimating the true impact of g on group differences after accounting for item bias. There was indeed an account that the effect of g increases when biased items are removed (te Nijenhuis et al., 2016). Another intriguing line of research is about the impact of cultural bias on heritability estimates of cognitive tests.
A popular argument implying that slavery legacy and racism-related effects cannot be measured, and therefore cannot be tested, does not threaten test bias research. If such effect translates into outcome similar to that produced by stereotype threat, then it can be detected. If not, then, a theory that cannot be tested is better called pseudoscience. Oddly, a term that is often used to describe research on race differences regardless of their content.
Discover more from Human Varieties
Subscribe to get the latest posts sent to your email.

Leave a Reply