The Classical Twin Design (CTD) has always been criticized for being oversimplistic, and consistently overestimating heritability estimates due to not accounting for GxE, GxG, rGE and equal environmental effects. It is almost never mentioned the bias is not systematic. The criticism largely exaggerates the flaws of the CTD, often misleadingly so, and apparently cherry-picking their evidence whenever large discrepancies in heritabilities are reported due to ignoring key assumptions inherent to the twin design. This article will show why the CTD and its extensions are robust methods, but with a strong focus on the Equal Environment Assumption (EEA).
The classical twin design withstood past criticisms, duo to employing a large variety of methods to test the key assumptions (Plomin & Bergeman, 1991; Andrew et al., 2001; Johnson et al., 2002; Christensen et al., 2006; Kendler & Prescott, 2006, ch. 6; Segal & Johnson, 2009; Plomin et al., 2013, ch. 6 & 12 & 17), and will likely withstand current ones (Tarnoki et al., 2022) in spite of some recent developments (e.g., Sunde et al., 2024) to improve the standard ACE models used to decompose genetic (h²) and shared and non-shared environmental (c² and e²) variances.
CONTENT
- Response to criticism: ACE is not a “fantasy” model
- EEA: Summary of Studies’ Methods, Results, Limitations
- EEA: IQ
- EEA: Psychiatric disorders
- EEA: Smoking, drug, alcohol
- EEA: Personality
- EEA: Parenting
- EEA: Religious and Political views
- EEA: Criminal behaviour
- EEA: Health and mental health
- EEA: Nutrition
- EEA: Education
- Research on unrelated look-alike pairs
This article will only cover twin-related research. GWAS will be dealt with later, although my (now) 10-year old article provided a good depiction of GWAS’ strengths and limitations at the time.
-
Response to criticism: ACE is not a “fantasy” model
Sasha Gusev recently attacked the ACE model, dubbing it a fantasy model. A realistic model would look like this:
2(rMZ−rDZ) = A + A ∗ C + 3/2(D+A∗A) + 2(CMZ−CDZ) − rA
This equation accounts for additive genetic effect (A), and its interaction with shared environment (C), non-additive effects (dominance + epistasis) weighted by twice the difference in shared genetic between MZ and DZ (2*(1-0.25), where 0.25 is the chance of sharing both paternal and maternal alleles), the difference in shared environment between MZ and DZ (the deviation from EEA owing to differences in treatment), and a correction for genetic relatedness (e.g., due to assortative mating). Most of these terms are “ignored” in the CTD.
Now let’s consider the following equation from Barnes et al. (2014) adapted from the formula in Plomin et al. (2013, appendix, p. 377) by Purcell:
Vp = A + D + I + C + E + 2Cov(A, D) + 2Cov(A, I) + 2Cov(A, C) + 2Cov(A, E) + 2Cov(D, I) + 2Cov(D, C) + 2Cov(D, E) + 2Cov(I, C) + 2Cov(I, E) + 2Cov(C, E)
The complexity of this equation can be simplified with a few assumptions. Here, D (dominance) and I (epistasis) are omitted whenever rDZ≥½rMZ, which in turn will also eliminate any covariance involving D or I, the covariance between additive and non-additive effects is omitted because those effects are independent by definition, the covariance between C and E is omitted for the same reason, the covariance between A and C is not important if C is found to be very small.
The reason why CTD is overly criticized is due to the involvement of the following terms: non-additive effects (D and I), rGE, G×E, assortative mating, and EEA. Let’s address them fully.
First, non-additive genetic effects. The CTD cannot estimate both C and D because they are negatively confounded as they require the same piece of information. Indeed, the biometric model keeps D if rDZ<½rMZ and keeps C if rDZ≥½rMZ. But this does not apply to twin-(adoptive)sibling design because these siblings share an environment but no genetic relatedness, allowing C and D to be distinguished and estimated simultaneously. Although recent developments by Jöreskog (2021a, 2021b) indicate that the full ACDE parameters can be estimated using only classical twin data, Dalliard noticed some critical assumptions were not met. While it is true that modeling ACE does not imply that D does not exist, as it may be concealed by C, it would be misleading to conclude that ACE is uninformative. That ACE fits better than ADE most of the time not only implies that C is more likely than D but that D is likely not very large in most cases. This is consistent with the observation, in IQ research especially, that D is almost non-existent, maybe with the exception of inbreeding (Hill et al., 2008; Plomin et al., 2013, p. 199). Given the negligible impact of the shared environment observed in adoption studies, it is no wonder why C is also dropped. The parameter I, denoting epistasis, is likely not even a candidate for potential confound. About non-additivity, Lee (2010) once noted:
Data on additional familial relationships, however, provide a test of a model where most of the genetic variance is additive rather than epistatic (Table 1). The small impact of sharing a household on familial resemblance greatly constrains the environmental degree of freedom that makes epistasis a viable candidate for explaining the resemblance between MZ twins. … These theoretical considerations were borne out in a meta-analysis showing that the difference between the MZ and twice the DZ twin correlations is centered around zero for 86 assayed physical and behavioral traits (Hill, Goddard, & Visscher, 2008). The most parsimonious explanation of this pattern is that additive genetic variance typically accounts for much of the total genetic variance.
Hill et al. (2008, Table 6) argued that, under selection, dominance variance (VD) is necessarily small because alleles are either very rare or very common, causing dominance effects to occur less frequently: “The theoretical models we have investigated predict high proportions of additive genetic variance even in the presence of non-additive gene action, basically because most alleles are likely to be at extreme frequencies. […] The distribution of allele frequencies is expected to be independent of which are the dominant or epistatic alleles for neutral polymorphisms; but under natural selection the favourable allele is expected to be common and lead to high or low VA/VG depending on whether it is dominant (low VA) or recessive (high VA). The equivalent case for epistasis is that all genotype combinations except one is favourable (low VA) vs. only one genotype combination is favourable (high VA). If genetic variation in traits associated with fitness is due almost entirely to low frequency, deleterious recessive genes which are unresponsive to natural selection, these traits would show low VA/VG. However, neither the empirical evidence nor the theory supports this expectation.”
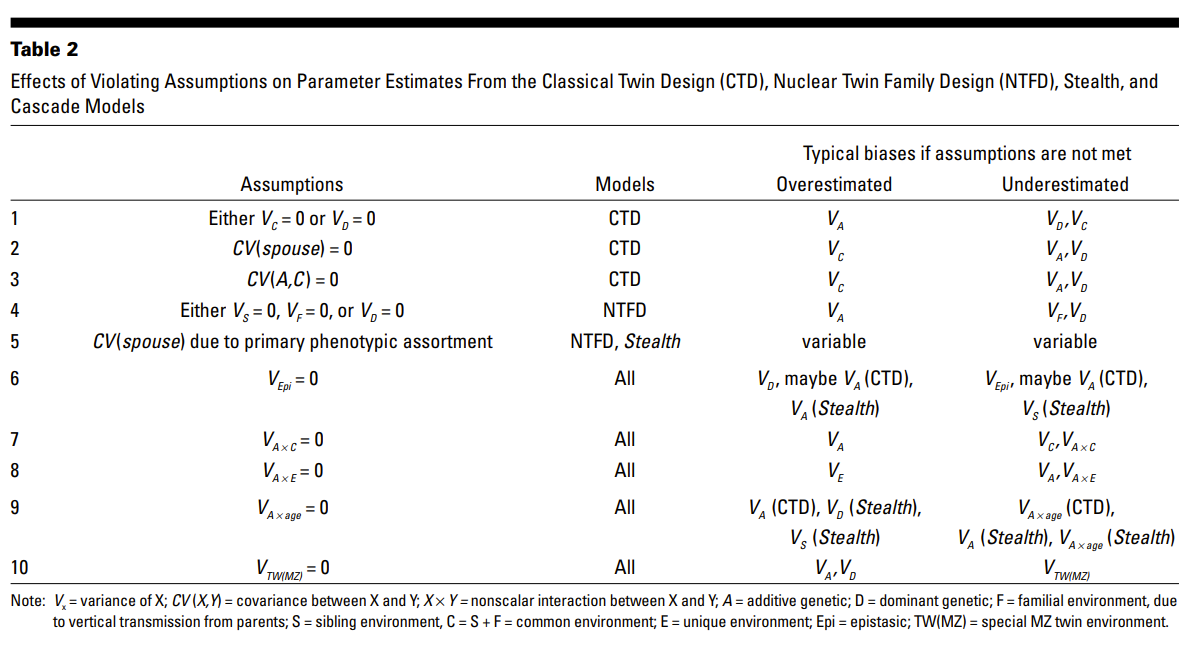
Second, rGE. A common misconception is that unmodeled rGE will always result in inflated heritability. Verhulst & Hatemi (2013) use simulations to demonstrate that: unmodeled rAC causes downward (upward) bias in heritability if the correlation is positive (negative), whereas unmodeled rAE causes upward (downward) bias in heritability if the correlation is positive (negative). So the direction of bias depends on the environmental component (C or E) that is involved. If an individual’s genes lead them to seek specific environments that influence the phenotype, the environmental mediation under this positive rAE implies that heritability should be interpreted as the impact of genetic factors on the development of the phenotype. The magnitude of rGE may be small. When C is small (which is often true) then cov(A,C) will be small as well. While E is typically large, it contains both a unique environment and measurement error. Most behavioral variables (except IQ and education) are often poorly measured, especially in very large surveys. Thus, cov(A,E) should only involve the reliable variance of E. Passive, reactive or active rGE can be detected using various methods. As I pointed out in my earlier review, many studies concluded that the effect of either rGE type was weak or non-existent for IQ. More powerful designs such as the twin family study found no passive rGE for IQ (van Leeuwen et al., 2008; Vinkhuyzen et al., 2012; Wolfram et al., 2024).
Third, G×E. A common misconception is that the heritability is always overestimated in the presence of G×E. Verhulst & Hatemi (2013) use simulations to demonstrate that: A×C causes an upward bias in heritability but with smaller bias when the true heritability is higher, whereas A×E causes a downward bias in heritability but with larger bias when the true heritability is higher. There are many ways to test for G×E using CTD by applying 1) a moderated or stratified ACE model using an environment variable 2) a multi-level regression where the level 1 specifies the DeFries-Fulker model and level 2 incorporates the environmental variance, such as school or state. Several studies reviewed here applied such moderated and stratified models, and the assumptions of which have been explained in detail (Purcell, 2002). There are several issues with the empirical findings. Overall, G×E is not really important (Polderman et al., 2015), has no generalizable pattern (Tucker-Drob & Bates, 2016; de Zeeuw & Boomsma, 2017), has often been tested using improper controls (Keller, 2014), depends on the methodology being used (Molenaar et al., 2013), depends on the measure of the environmental variable (Dong et al., 2023), is riddled with false positives and is the result of publication bias (Duncan & Keller, 2011; McGue & Carey, 2017). The absence of G×E under extreme poverty conditions such as Nigeria potentially dismantles the poverty threshold hypothesis for genes associated with IQ (Hur & Bates, 2019). A less known bias is that G×E could be partly a result of statistical artefact. There is enough evidence that lower IQ/SES individuals provide poorer data quality, which means errors are not equally distributed across the ability distribution. This non-random measurement error could potentially underestimate heritability due to inflating the non-shared environment among low-IQ/SES individuals. Methods typically used to handle measurement error can only correct for random measurement error. One could argue that random measurement error attenuates G×E but this argument applies to heritability as well. And there is yet another complexity. Some studies support the null effect. Some support the Scarr-Rowe hypothesis. Some others support the compensatory advantage hypothesis (Ruks, 2022; Woodley et al., 2024; Ghirardi et al., 2024). Some found that the pattern of G×E changes across ages and may eventually become non-significant at adolescence or adulthood (Gottschling et al., 2019). The opposing mechanisms underlying these two competing hypotheses (which could occur simultaneously) reflect non-linearity in G×E effects, as was predicted by Eaves et al. (1977), and further elaborated by Eaves et al. (1978, pp. 255-256), who rightfully argued that systematic linear G×E effects can be easily detected, but not unsystematic G×E:
There is no particular reason why such effects should be linearly related to the genotypic mean. Indeed, there are many situations in which we might find significant non-linear trends. Society may react in a uniform way to extreme deviations on either side of the population mean. This would produce a pattern of G x E which shows greater environmental variation in the middle of the scale than at either end. In practice, this kind of interaction is common in psychometric data because of floor and ceiling effects. […] Thus, although G x E may pass undetected if it is completely unsystematic, and although G x E will bias our estimates of genetical and environmental variance in such circumstances, it will nonetheless bias equally our estimates of DR and E2 in the same direction.
Fourth, assortative mating (AM). It is typically acknowledged that not accounting for AM will cause downward bias in heritability in twin studies, due to upward bias in rDZ relative to rMZ. Biometric analyses sometimes compare the phenotypic assortment and social homogamy models to explain AM. These models yield different heritability estimates and sometimes these models are cursed due to fitting almost equally well. A recent development by Sunde et al. (2024) observed two problems with the usual methods used to account for AM: 1) the assumption of direct AM, i.e., assortment based on the focal phenotype, may not always hold such as with education attainment, 2) the mechanisms underlying assortment are not distinct and the degree of genetic (A), social (C), and individual (E) assortment may not be proportional to the importance of genetic (A), social (C), and individual (E) factors on the focal phenotype. They proposed a more flexible method using a “sorting factor” which is a latent variable comprising the set of traits associated with the focal phenotype that partners are assorting on and which captures the relative strength of genetic factors, shared, non-shared environments. The heritability is biased upward (downward) if the sorting factor is more environmentally (genetically) driven.
Fifth, twin effect (EEA). An indirect way to test EEA is to compare same-sex and opposite-sex twins. Environments are definitely different between these two groups. Yet Dalliard noticed that the correlations are similar between these two groups, across all traits, therefore rejecting EEA. The important question though is not whether EEA is violated but how heritability is impacted. An interesting observation is that the twin effect does not always affect heritability, sometimes it only increases the shared environment. Some would argue this is due to other unmet assumptions, which makes the true impact of the twin effect hard to evaluate. A couple studies reviewed here showed a large twin effect along with a high heritability. The studies reviewed here that compared age groups also showed a tendency for the twin shared effect to decline (sometimes drastically) as the adolescents approach adulthood. Perhaps more importantly, the common interpretation of such EEA violation is unfounded. Given that more genetically similar individuals select more similar environments or “niches”, EEA can hardly be treated as a pure environmental effect (e.g., due to treatment similarity) when considering niche selection effects (Eaves et al., 2003). The twin environmental effect (denoted t² or T) that is estimated when accounting for EEA in biometric models is often coined specific shared environment, which is fine as long as it is not interpreted as a measure of between-family influence. Environments that are sibling-specific and twin-specific only concern inequalities that occur within families. As Wolfram & Morris (2023) pointed out: “these within-family differences in opportunity are not the kind that ordinarily preoccupy policymakers or advocacy groups”. Sibling and twin environments actually inflate shared environments unless they are treated as components distinct from the C component. Sibling effects can occur if the educational decisions of one sibling guide those of other siblings, with older siblings serving as a role model for younger ones. This environment is the result of mutual influences of siblings, not the direct consequence of parents’ actions.
In practice, are these key assumptions tested appropriately?
The standard biometric models, which employ multi-group SEM to decompose the ACE parameters, have been described both technically (Heath et al., 1989b; Neale & Maes, 2004) and non-technically (Neale, 2009; Posthuma, 2009; Morosoli et al., 2022). These standard models are flexible enough to allow modeling of sex limitation and sex moderation effects, G×E and rGE effects. But extensions of this classical twin design have been proposed and used quite often (Maes et al., 1997, 2018; Vinkhuyzen et al., 2012; Hahn et al., 2013). This is called the Extended Twin (ET) study and requires data on the twins’ family members, such as their parents, other siblings, spouses and children. Such a design allows the estimation of passive rGE, assortative mating (AM), parents’ environmental transmission, twin special environment (T), maternal effect (Truett et al., 1994, Table 5; Keller et al., 2009, Table 2). These methods were found to be quite robust to assumptions (Keller et al., 2010). A less restrictive design is the twin-sibling model that allows the ACE model to be estimated along with the twin effect by comparing DZ and non-twin sibling covariances. Obviously, none of these designs will answer all questions at once. But when considering the totality of the evidence based on other research designs, the twin design stays on solid grounds (Tarnoki et al., 2022).
Other study designs such as sibling, virtual twins, and adoption typically validate the classical twin design (Rowe, 1994, ch. 3 & 4; Segal, 2012; Kendler et al., 2014, 2019; Willoughby et al., 2021; Segal & Pratt-Thompson, 2024). Obviously, critics argued other designs are flawed. Yet one needs to read the whole story (Bouchard Jr, 2023). There is no convincing evidence that any of these designs consistently bias heritability in one specific direction.
-
EEA: Summary of Studies’ Methods, Results, Limitations
Methods to assess EEA are quite varied: correlations, regressions, misclassified zygosity, children of twin (CoT), moderated DeFries-Fulker regression, classical twin (ACE-multivariate, ACE-moderated, ACCE), twin-sibling (ACTE), extended twin family design (ACTE + cultural transmissions + assortment + rGE), twin-(adoptive)sibling (ACDTE). Correlation and regression analyses assess the relationship between environmental similarity and focal phenotype within pairs, but they provide the weakest evidence because they don’t show how heritability is impacted. The moderated DF regression simply adds the twin environmental variable and its interaction in the equation to test for possible moderator effect. Biometric models can’t disentangle treatment effects and niche selection effects but are still more convincing. The most elegant, but unfortunately never used, is the ACE-multivariate method proposed by Derks et al. (2006) which requires no childhood twin environment or adult social contact variable and no sibling or family data. The ACE-moderated examines how the parameters differ between the low and high contact groups. The ACCE model adds a second shared environment component, indexed by the environment or social contact variable. The ACTE examines whether the twins have an extra source of shared environment by contrasting DZ and full siblings.
Below is the summary table of all papers reviewed presently. Some results are ambiguous (?) but most indicate that EEA holds. When the correlation or regression coefficients are reported as being modest/large or the twin environment (t²) accounts for at least 8-9% of the total variance I typically consider EEA violated.
| Author | Sample | Outcome | Method | EEA |
| Scarr 1968 | Boston | IQ, personality | Misclassified | Yes |
| Scarr & Saltzman 1979 | Philadelph | IQ, personality | Regression | Yes? |
| Matheny 1976 & 1979 | Louisville | IQ, personality | Correlation | Yes |
| Munsinger, Douglass 1976 | MoTC | IQ | Correlation | No? |
| Vogler & DeFries 1986 | CTR | IQ | ACTE+AM | Yes |
| Grigorenko, Carter 1996 | Moscow | IQ | Correlation | No? |
| Bishop et al 2003 | LTS+CAP | IQ | ACTE | Yes |
| Koeppen et al 2003 | TEDS | IQ | ACTE | No |
| Koeppen et al 2003 | TEDS | Behavior problem | ACTE | Yes |
| Derks et al 2006 | Osborne | IQ | ACE-multivar. | Yes |
| Derks et al 2006 | NTR | Aggression | ACE-multivar. | Yes |
| Vinkhuyzen et al 2012 | NTR | IQ | ACTE+AM | Yes |
| Clifford et al 1984 | London | Anxiety, depression | ACTE | No |
| Hettema et al 1995 | VTR | Various disorders | ACCE | Yes |
| Kendler et al 1993 | VTR | Disorders, alcohol | Misclassified | Yes |
| Kendler et al 1994 | VTR | Disorders, alcohol | ACCE | Yes |
| Tambs et al 1995 | NBR | Anxiety, depression | ACE-adjusted | Yes |
| Kendler & Gardner 1998 | VTR | Disorders, smoking | Regression | Yes |
| Bulik et al 1998 | VTR | Eating disorder | Regression | Yes |
| Slutske et al 1997 | ATR | Conduct disorder | Regression | No? |
| Eisen et al 1998 | VET | Gambling disorder | Misclassified | Yes |
| Carmelli et al 2000 | NHLBI | Depression | Correlation | Yes |
| Klump et al 2000 | MTFS | Eating disorder | Correlation | Yes |
| Cronk et al 2000 | Missouri | Various disorders | ACE-adjusted | Yes |
| Jacobson et al 2002 | VTR | Antisocial behavior | Regression | Yes |
| McCaffery et al 2003 | NHLBI | Depression | Regression | Yes |
| Romanov et al 2003 | FTC | Depression | Regression | Yes |
| Kieseppä et al 2004 | FTC | Bipolar I disorder | Correlation?? | Yes |
| Ehringer et al 2006 | CTR | Various disorders | ACTE | Yes |
| Kendler et al 2006 | STR | Depression | Regression | Yes |
| Mazzeo et al 2010 | VTR/MATR | Eating disorder | ACE-moderated | Yes |
| Meier et al 2011 | ATR | Conduct disorder | Regression | No? |
| Blanco et al 2012 | Web | Gambling disorder | ACTE | Yes |
| LoParo & Waldman 2014 | Georgia | Various disorders | Regression | Yes |
| Herle et al 2016 | Gemini | Eating behavior | Misclassified | Yes |
| Nikstat & Riemann 2020 | TwinLife | Problem behavior | ACTE+AM | Yes |
| Kaprio et al 1987 | FTC | Alcohol | Regression | No |
| Rose et al 1990 | FTC | Alcohol | ACE-adjusted | Yes |
| Heath et al 1989a | ATR | Alcohol | Correlation | Yes |
| Prescott et al 1994 | AARP | Alcohol | Correlation | No? |
| Heath et al 1997 | ATR | Alcohol | Correlation | Yes |
| LaBuda et al 1997 | Minnesota | Alcohol, drug | Regression | Yes |
| Kendler et al 1997 | STR | Alcohol | ACCE | Yes? |
| Prescott & Kendler 1999 | VTR | Alcohol | Regression | Yes |
| Kendler et al 2000a | VTR | Substance use | ACCE | Yes |
| Xian et al 2000 | VET | Substance, disorder | ACCE | Yes |
| Horwitz et al 2003 | Add Health | Alcohol | Regression | No? |
| Horwitz et al 2003 | Add Health | BMI, depression | Regression | Yes |
| Rhee et al 2003 | CTR+CAP | Substance use | ACDTE | No? |
| Lessov et al 2004 | ATR | Smoking | ACE-stratified | Yes |
| Penninkilampi 2005 | FTC | Alcohol | ACE | Yes |
| Rende et al 2005 | Add Health | Smoking, drinking | DF stratified | Yes |
| Hamilton et al 2006 | CTP | Smoking | ACE-stratified | Yes? |
| Young et al 2006 | CTR | Substance use | ACTE | No? |
| Morley et al 2007 | ATR | Smoking | ACTE | Yes? |
| Boardman 2009 | Add Health | Smoking | DF multilevel | Yes |
| Koenig et al 2010 | FTS | Alcohol, drug | Children of Twin | Yes |
| Kendler et al 2014 | SNR | Drug abuse | ACTE | Yes |
| Kendler et al 2016 | STR+SMG | Alcohol | ACTE | No? |
| Bares et al 2017 | Add Health | Smoking | ACTE | Yes |
| Maes et al 2018 | VTR+ATR | Smoking | ACTE+AM | No |
| Verhulst et al 2018 | VTR+ATR | Alcohol | ACTE+AM | Yes? |
| Plomin et al 1976 | MoTC | Personalities | Correlation | No? |
| Cohen et al 1977 | MoTC | Personalities | Misclassified | Yes |
| Phillips et al 1987 | Indiana | Fear | ACTE+AM | Yes? |
| Rose et al 1988 | FTC | Neurotic., extraver. | Correlation | No |
| Kaprio et al 1990 | FTC | Neurotic., extraver. | Correlation | No? |
| Morris-Yates al 1990 | ATR | Neuro, anxiety, dep. | Correlation | Yes |
| Braungart et al 1992 | LTS+CAP | Infant behavior | ACDE-equal | Yes |
| Roy et al 1995 | VTR | Self-esteem | Regression | Yes |
| O’Neill & Kendler 1998 | VTR | Dependency | Regression | Yes |
| Goldsmith et al 1999 | US states | Infant behavior | Correlation | Yes? |
| Bailey et al 2000 | ATR | Sexual orientation | Correlation | No? |
| Jonnal et al 2000 | VTR | Obsessiv., compulsiv. | Regression | Yes? |
| Lake et al 2000 | ATR+VTR | Neuroticism | ADTE+AM | Yes |
| Kendler et al 2000b | MFMD | Sexual orientation | Regression | Yes |
| Borkenau et al 2002 | BWTS | Big Five | Regression | Yes |
| Hunt & Rowe 2003 | Add Health | Sexual intercourse | DF moderated | No? |
| Wade et al 2003 | ATR | Body attitudes | Regression | Yes |
| Keller et al 2005 | ATR | Personalities | ADTE | Yes |
| Tholin et al 2005 | STR | Eating behavior | ADE-stratified | Yes |
| Eriksson et al 2006 | STR | Activities | AE-simulated | No |
| Weber et al 2011 | MIDUS | Group identity | Regression | Yes |
| Hahn et al 2013 | GSOEP | Big Five | ACDE-equal | Yes |
| Matteson et al 2013 | MTFS | Personalities | ACDTE | Yes |
| Bleidorn et al 2018 | TwinLife | Self-esteem | ADTE+AM | Yes |
| Klassen et al 2018 | TwinLife | Achiev. motivation | ADTE+AM | Yes? |
| Rowe 1983 | California | Family environment | Biometric model | ??? |
| Goodman, Stevenson 1991 | London | Parenting | Misclassified | Yes |
| O’Connor et al 1995 | NEAD | Parent-child | ACDE-equal | Yes |
| Schulz-Heik et al 2009 | Add Health | Maltreatment | ACTE | No? |
| Vinkhuyzen et al 2010 | NTR | Life events | ACTE/ADTE | Yes |
| Maes et al 1999 | VTR | Church attend. | ACDTE+AM | Yes |
| Maes et al 1999 | VTR | Alcohol | ACDTE+AM | No? |
| Truett et al 1994 | VTR | Church attend. | ACDTE+AM | No |
| Eaves & Hatemi 2008 | VTR | Abortion, gay rights | ACDTE+AM | ??? |
| Hatemi et al 2009 | VTR/MATR | Political attitudes | Correlations | Yes |
| Hatemi et al 2010 | VTR/MATR | Political attitudes | ACTE+AM | Yes |
| Smith et al 2012 | MTFS | Political attitudes | ACE-moderated | Yes |
| Littvay 2012 | MTPS | Political attitudes | ACCE | Yes |
| Bell et al 2018 | JeTSSA | Political attitudes | ACTE+AM | Yes? |
| Kornadt et al 2018 | TwinLife | Pol. participation | ADTE+AM | Yes |
| Hufer et al 2020 | TwinLife | Pol. orientation | ACTE+AM | Yes |
| Dalgard, Kringlen 1976 | Norway | Crime | Percentage | ??? |
| Kendler et al 2007 | VTR | Delinquency | ACCE | Yes |
| van der Aa et al 2009 | NTR | Truancy | ACTE | No |
| Kendler et al 2015 | SMGR | Crime | ACCE | Yes |
| Heller et al 1988 | Countries | Smoking, exercise | Percentage | No |
| Neale et al 1994 | VTR | Fears, phobias | ACCE | Yes |
| Maes et al 1997 | VTR | BMI | ACTE+AM | Yes |
| Svensson et al 2003 | STR | Migraine | Regression | Yes |
| Kessler et al 2004 | MIDUS | Mental health | ACTE | Yes |
| Nes et al 2010 | NIPHTP | Well-being | ACTE/ADTE | No |
| McCaffery et al 2011 | VET | BMI changes | ACCE | No |
| Bergin et al 2012 | VTR | BMI changes | ADTE+AM | No |
| Fabsitz et al 1978 | NHLI | Food composition | Correlation | No |
| van den Bree 1999 | AARP | Eating pattern | Correlation | Yes |
| Gunderson 2006 | KPTR | Dietary intake | Misclassified | Yes |
| Eaves et al 2011 | VTR+ATR | Education | ACTE+AM | No |
| Conley et al 2013 | Add Health | BMI, GPA, ADHD | DF | Yes |
| Conley et al 2013 | STR | BMI, GPA, ADHD | Correlation | Yes |
| Conley et al 2013 | MTFS | BMI, education | Correlation | Yes |
| Felson 2014 | MIDUS | 32 varied outcomes | DF moderated | Yes |
| Felson 2014 | L&N1976 | Test scores | Correlation | Yes |
| Eifler et al 2019 | TwinLife | Grades | ACTE | No? |
| Eifler & Riemann 2022 | TwinLife | School leaving | ACTE | No |
| Mönkediek 2021 | TwinLife | Grades, school track | Regression | Yes |
| Starr & Riemann 2022 | TwinLife | IQ, SPA, grades | ACTE/ADTE | Yes |
| Bingley et al 2023 | DTR | Education | ACE-avuncular | No |
| Wolfram & Morris 2023 | TwinLife | Education | ACTE+AM | No |
These researchers often take for granted that there is no classical measurement error, or non-random measurement error, or systematic response bias to worry about. It has been demonstrated on multiple occasions that correction for error leads to increased heritability (O’Connor et al., 1995; Riemann et al., 1997; Lake et al., 2000; van Leeuwen et al., 2008). By far the worst design is the correlation using intrapair absolute differences. The score differences of a variable measured with error is even less reliable than its score levels, therefore biasing the correlation toward the null. On the other hand, non-random error is never considered, not even once. This is crucial here because twins’ measures are typically averaged, and then analyzed as such. If the scores within pairs vary (i.e., they are less congruent) depending on IQ, SES, any background variable or on the studied phenotype, the assumption of classical measurement error is violated, and traditional error-correction methods (i.e., the great majority) will not fix this problem.
One advantage of twin-sibling design is its increased power to detect D (Posthuma & Boomsma, 2000) and not having to rely on questionable measurement of twin environments. On the other hand, it has been acknowledged by several authors (Bishop et al., 2003; Koeppen-Schomerus et al., 2003) that the twin-sibling design is biased toward finding such twin special effects t² because twins are tested at the same occasion but not non-twin siblings despite being all tested at the same age.
A major problem with biometric models overall is the reliance of χ2 (very sensitive to sample size) for model selection. Sometimes a non-trivial c² effect is dropped simply because it is non-significant. Reliance on model fit indices such as CFI would be a much better approach (see, e.g., Bleidorn et al., 2018; Klassen et al., 2018). If statistical tests suggest a reduced model is better despite the non-significant parameter being somewhat “large”, the estimates of both the most constrained and less constrained models should be reported. But this is almost never done.
Multivariate models must be conducted whenever possible, because they provide informations about common influences. In the case of IQ, by far the most important question is whether shared environmental effects are g-loaded. Vogler & DeFries (1986, Table 6) found that the twin effect is often large when using the univariate model, but this twin effect is not shared between the latent cognitive factors in the multivariate model. No g.
-
EEA: IQ
Scarr (1968, Tables 3-4) analyzed 61 twin pairs from Boston, of which 11 were misclassified by their mothers. Twins were blood-grouped and they showed no difference in IQ (100.4) or age (95 months). Outcome variables include mothers’ interviews on 1) dressing alike, 2) recall of similarities and differences about behaviour problems, 3) the Vineland Social Maturity Scale (VSMS) which measures social maturity and adaptive behavior, 4) the Adjective Check List (ACL) which is an instrument containing 300 adjectives and comprising 26 personality scales. The author observes: “The mothers of MZ twins, whom they wrongly believe to be DZ, treat them more like correctly identified MZ twins. And the mothers of DZ twins, whom they believe to be MZ, treat them more like correctly classified DZ pairs.” The general pattern supports EEA, although there are some exceptions.
Scarr & Carter-Saltzman (1979, Tables 4-5) use a sample of 104 MZ and 122 same-sex DZ twins, 10-16 year-old twins from black and white populations in Philadelphia. Each twin was asked about his zygosity and similarity (4 items) to his co-twin. Physical similarity also includes objective measures such as skeletal growth (stature, sitting height, skeletal age), tissue growth (weight, upper arm circumference, triceps skin fold thickness), skin reflectance, blood group loci. Outcomes include cognitive tests (Raven’s matrices, PPVT, Columbia Mental Maturity Scale, Benton’s Visual Retention Test) and personality tests (Eysenck Personality Inventory (EPI) and Coopersmith Self-Esteem Inventory). To test EEA, twin differences in cognitive scores were regressed on the perceived and physical differences of MZ and DZ pairs separately (for DZ only, the number of blood group differences between co-twins was also included as a predictor). For both groups, the coefficients were often very small and the signs were sometimes negative, sometimes positive. Regarding personality tests, the authors did not report their numbers but their discussion suggests mixed results regarding EEA.
Matheny et al. (1976) examine 121 MZ and 70 same-sex DZ pairs aged 3.5-13, drawn from Louisville. Physical similarity was measured by 4 items, along with a questionnaire about how often they dress alike. Outcomes include IQ measures (Stanford Binet for younger twins and WISC for older twins), reading achievement (California Reading Test), personality (from the Children’s Personality Questionnaire which assesses 14 dimensions). The twins’ within-pair difference scores were ranked on all measures, then correlated with their rankings for the physical similarity scores. Spearman correlations (corrected for ties) were calculated for MZ and DZ pairs separately. Negative correlations are interpreted as validation of EEA because the higher the physical similarity score and the smaller the within-pair difference on the behavioral measure. The result holds true regardless of the group (MZ or DZ) and regardless of outcomes (cognitive, achievement, or personality tests). The sign of the correlations is sometimes negative, sometimes positive, with no clear pattern. Matheny (1979) later used the same sample but compared actual zygosity and parental perceived zygosity. Within-pair difference in Stanford-Binet IQ was identical among MZs regardless of parental classification, but the difference in IQ was larger among DZs wrongly perceived as MZs.
Munsinger & Douglass II (1976, Table 5) use a sample of 37 MZ and 37 DZ pairs drawn from the Mothers of Twins Clubs in San Diego. They took two language tests: the Assessment of Children’s Language Comprehension (ACLC) and the Northwestern Syntax Screening Test (NSST). Comparison of zygosity through blood type and parental belief showed small differences for both MZ correlations and DZ correlations, although the pattern of these differences suggests a violation of EEA.
Vogler & DeFries (1986, Table 6) illustrated the advantage of the twin family design by examining 1125 individuals from Colorado. The age-adjusted reading, coding speed, and spatial ability are used In their multivariate model. They tested a series of constraints by specifying, e.g., no genetic or cultural transmission, no cross-trait assortative mating, no sibling or twin environment, etc. The best model yields heritability and total environment of .37 and .63 for reading, .45 and .55 for both coding and spatial. While the twin t² effect accounts for a large portion of the total environment on each variable, there is no t² effect between variables. That the twin effect holds only within cognitive tests, but not across, implies that the same t² effect does not carry over across cognitive dimensions. Said otherwise, it is unrelated with g. Although that wasn’t the point of their paper, it is interesting that they didn’t mention this detail.
Grigorenko & Carter (1996, Table 6) analyzed a small twin sample drawn from Moscow. The study focuses on PIQ, VIQ and FSIQ from the WAIS. Mothers were given 2 questions regarding their emphasis on twin dis/similarity. Twin environment is measured with 120 items, forming 3 scales with 40 items each: relationship (subdivided into close/conflict relations and attitudes toward dis/similarity), leader status, social network (subdivided into closest person and narrow/wide circle of friends). The results are similar for FSIQ, PIQ, and VIQ. Attitudes toward similarity and close relations both strongly increase the intrapair correlations among DZs but do not impact those correlations among MZs. Mothers’ attitudes toward similarity strongly increases intrapair correlations among DZs.
Bishop et al. (2003) use a sample combining twins and adoptive/non-adoptive siblings from the LTS and CAP (Total=~600, but huge attrition over time among twins). All subjects took the Bayley Mental Development Index at ages 1-2, the Stanford–Binet at ages 3-4, and the WISC-R at ages 7-12. The total score of the Bayley, SB and the first Principal Component score of the WISC-R are used as outcomes. Their developmental model specifies a common factor present at all ages and a simplex model of age-to-age transmission effects. Dropping the special twin environment does not deteriorate model fit. Their comment reads: “This result is especially noteworthy because the combined twin and sibling design is biased in favor of finding such effects in the sense that the twins are tested at the same age on the same occasion, whereas siblings are tested at the same age but on different occasions at least 2 years apart.”
Koeppen-Schomerus et al. (2003) analyzed 1800+ MZ pairs and 1800+ same-sex DZ twin pairs, and 130+ same-sex twin-sibling pairs, aged 2-3 in the TEDS. Outcomes include the MacArthur inventory (MCDI) short-form which measures vocabulary and grammar and of the PARCA which measures nonverbal ability. Both inventories are parent reports of children’s abilities. PCA was applied to age- and sex- corrected data from the PARCA and the MCDI, yielding a g factor score. For all 3 cognitive measures, their genetic model fitted better when shared environment was allowed to differ between twin-twin and twin-sibling pairs. At age 2, the estimates were: h² = .20-.22, c² = .31-.42, t² = .30-.33, and e² = .04-.17. At age 3, the estimates were: h² = .22-.30, c² = .31-.43, t² = .20-.28, and e² = .08-.16. The study would be more convincing by studying adult samples. They also fitted the model for behavior problem using RRPSPC (test-retest r=.87), and found that h² was high (.57 and .55) and t² equal to zero at both ages.
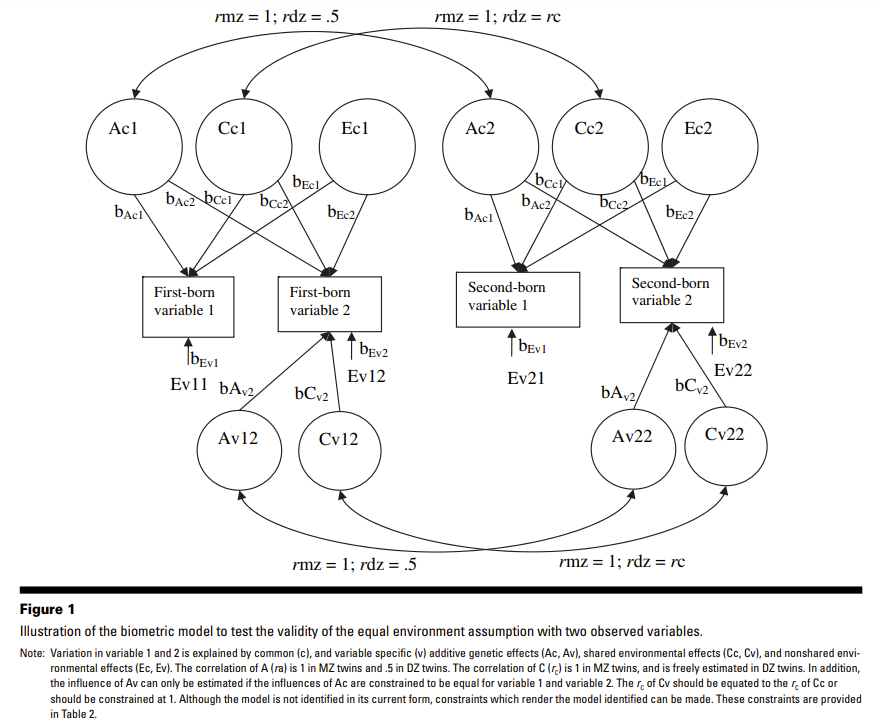
Derks et al. (2006) conducted two studies. One uses Osborne’s (1980) twin data on spatial IQ based on two subtests. The second uses 1534 twin pairs from the Netherlands Twin Register (NTR), who have completed the CBCL and the CPRS-R:S. The CBCL contains 20 items on aggression, subdivided into two subscales: direct aggression (6 items) and relational aggression (14 items). The CPRS-R:S contains 6 items on oppositional behaviour, summed into a total score. EEA is tested using a multivariate ACE model without a need for a twin environmental variable. The procedure consists in equating r(Cv) to r(Cc) where Cc is denoted as the influence of C common to all observed phenotypes (i.e., observed variables) and Cv the influence of C that is specific to each variable. EEA is rejected if all of these parameters are not equal, or if r(Cc), constrained to 1 in MZ twins and freely estimated in DZ twins, is lower than 1 in DZ twins. Their first analysis uses their 3 indicators of aggression: relational and direct aggression, and oppositional behavior from the NTR data. They found that a model in which the r(Cc) equals 1 in same-sex DZ twins does not worsen the model, which validates EEA. Their second analysis based on Osborne’s (1980) black and white twin data, comprising 171 MZ and 133 same-sex DZ twins aged 12-19 years, showed that spatial IQ does not violate EEA. An interesting observation is that the dilemma caused by the possible difference in environmental influences between genders can be dealt with by not combining same-sex and opposite-sex DZ twins.
Vinkhuyzen et al. (2012, Table 2) use data from 1,314 participants (276 MZs, 323 DZs, plus parents/siblings of twins and children/spouses of twins) of the Netherlands Twin Register (twins’ age = 39.81). Twins and siblings completed the WAIS-IIIR in wave 1 and all participants completed 7 subtests of the WAIS-IIIR. Within the saturated model (i.e., prior to constraining dominance, assortative mating, parental environmental transmission, and GE covariance effects), correlations via DZ twin pairs and regular sibling pairs could be constrained to equality without worsening model fit. This means there is no special twin environment.
-
EEA: Psychiatric disorders
Clifford et al. (1984) examined 572 twin pairs (aged 16-70) and 211 non-twin siblings from a twin register in London. Alcohol consumption was assessed using the Manitoba Health and Drinking Survey (1-year test-retest r=.80). Anxiety and depression were assessed by the 8-item Middlesex Hospital Questionnaire. Genetic models that consider the correlation between pairs of individuals (parent-offspring, siblings, MZ and DZ twins) were fitted as a function of cohabitation history. Models for all 3 outcomes fitted best when twin environments were specified and allowed to vary with cohabitation history. The model-implied MZ and DZ correlations were much larger for cohabiting pairs than living-apart pairs. The heritabilities for alcohol consumption, anxiety, and depression were 37%, 19%, 13% for models which include twin environments and 49%, 32%, 22% for models which don’t.
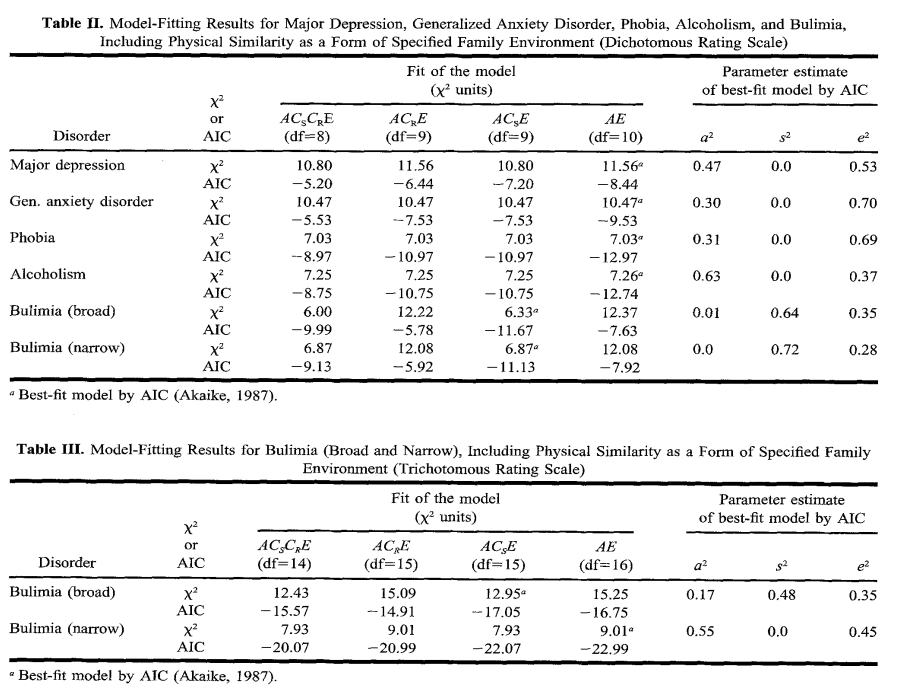
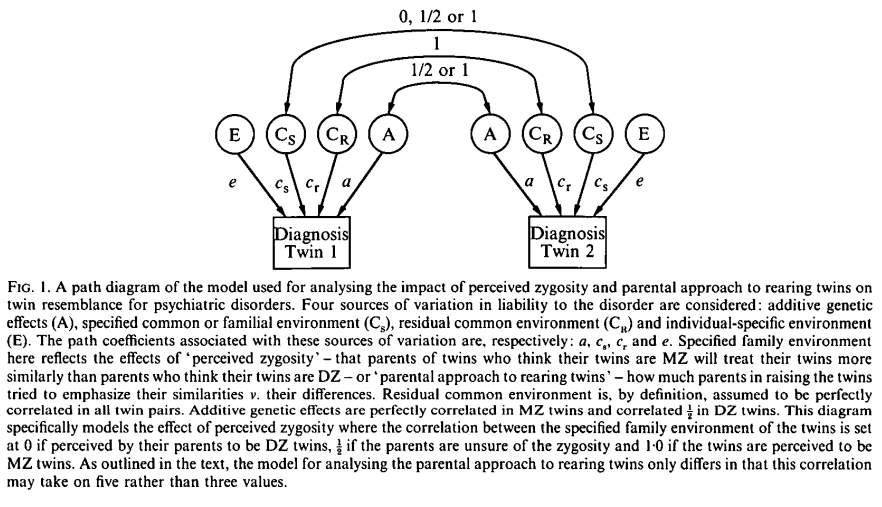
Hettema et al. (1995, Table 2) examined 590 MZ and 440 DZ twins from the Virginia Twin Register (VTR). Physical similarity ratings are based on photographs, as well as 2 questions for twins and parents about how difficult people can tell them apart. Outcomes used are the psychiatric disorders taken from the Structured Clinical Interview for DSM-III-R (SCID). The EEA was tested using the ACSCRE model, i.e., a modified ACE model in which C is divided into specified common (CS) and residual common environment (CR). The existence of CS effect would violate EEA. Results showed that the ACRE model has a better fit than the full ACSCRE model for major depression, generalized anxiety disorder, phobia and alcohol dependence, but not for bulimia nervosa. The fit of the AE model was also very similar to the ACSE model, except for bulimia. The best fit model for bulimia was one that includes physical similarity as a significant factor, namely the ACSE model, but this result is not robust to the measurement scale of physical similarity (dichotomous vs trichotomous).
Kendler et al. (1994, Tables 4-5) use a sample of 853 twin pairs (aged 29.3) from Virginia Twin Registry. The parent questionnaire included perceived zygosity which showed a correlation of r=.92 between spouses. Parents’ approach to rearing was measured by how often they emphasize similarities and differences. Outcomes include major depression, generalized anxiety disorder and alcohol dependence from the SCID, as well as phobias from the DIS III-A. Their inter-rater reliabilities are, respectively, .96, .77, 1.00, and .73. They use an extension of the ACE model (known as ACCE) that separates the C component into specified common environment (CS) and residual environment (CR). CS can be taken as the effect of perceived zygosity or parental approach to rearing twins. But because some parents were uncertain about the twins’ zygosity, the uncertain zygosity contributes ½CS² to twin similarity. Results support EEA. For all disorders, they found evidence of superior fit for the AE model compared to any model that incorporated the CS component for both mother’s and father’s perceived zygosity. This result was replicated when the models were fitted using instead the mother’s or father’s approach to rearing twins.
Earlier, Kendler et al. (1993) used 1030 female-female (aged 30.1) twins from the same VTR, with the same outcome variables, but adding bulimia nervosa. The analysis also employs ACCE models. This time, the approach takes advantage of mistaken identity based on a twin questionnaire. They tested whether EEA would hold by comparing groups of twins when both MZ correctly felt they were MZ, both MZ mistakenly felt they were DZ, and both DZ correctly felt they were DZ. EEA was validated and once again the best fit (by AIC) for all disorders was the AE model.
Tambs et al. (1995, Table 5) analyzed 2570 twin pairs (aged 18-25) in the Norwegian Birth Registry. The outcome, anxiety/depression, is measured with the 5-item version of the SCL-25 (α=.85). Social contact variables include: frequency of contact, perceived closeness during life, years together in school class, age when moved from childhood home, and distance between residences. They regress the intrapair differences (for MZ and DZ separately) on each measure of contact, to create a sum score weighted by the beta weight of each predictor. Because the mean value of MZ (DZ) contact is higher (lower) than the total mean, the MZ and DZ covariances are adjusted for these upward and downward values, and the biometric models are fitted based on the adjusted data. The estimates changed little for most of the submodels. In the best model, the ACE estimates are .408, .107, .485 after adjustment for frequency contact, and .427, .106, .466 before adjustment.
Kendler & Gardner (1998, Tables 2-3) examine 822 caucasian female same-sex twins (aged 61.3 months) from the VTR. Outcome variables include major depression, generalized anxiety disorder, panic disorder, bulimia, phobias, alcohol and nicotine dependence, smoking initiation. Environmental similarity is measured by 3 items at adolescence and 4 items at childhood, relationship within the twinship by 2 items, and self-perception of treatment by 3 items. A (varimax) factor analysis of these items produced 3 factor scores (based on eigenvalue > 1), identified as childhood treatment, co-socialization, similitude. Two logistic regression methods are used. In the pairwise logistic, the mean factor score of the twin pair is used to predict concordance (versus discordance) for the disorder in twin pairs while controlling for zygosity. In the individual logistic, the twin’s factor score, the twin’s affection status and the interaction between them are used to predict the probability of affection in the cotwin. The Odds Ratios for either logistic regression method and for either outcome are close to 1 and non-significant. There are two major exceptions. The ORs for Bulimia deviate greatly from 1 in either direction depending on the logistic regression or factor score used, and ORs for smoking initiation were significant and much larger than 1 when using co-socialization factor as predictor.
Bulik et al. (1998) investigate the lifetime history of binge-eating and bulimia nervosa (BN) assessed via the Structured Clinical Interview for DSM III-R, using 854 twin pairs (aged 30.1) from the VTR. To test EEA, they use a polychotomous logistic regression, with the number of times (0, 1, or 2) a twin pair was discordant for binge-eating or broad BN as outcome at either wave 1 or 3, as well as zygosity and, in turn, each of the six environmental variables (i.e., childhood treatment, co-socialization, similitude, physical similarity, degree of adult contact, and parental rearing attitudes). The first three are factor scores obtained from a factor analysis of 12 twin questionnaires. Physical similarity is based on ratings of photographs from Hettema et al. (1995), the last two are single questionnaires. Using logistic regression, they found no significant effect for any of the six environmental variables on twin discordance for binge-eating, but they found one significant effect for co-socialization on twin discordance for BN.
Slutske et al. (1997) use the 2-wave Australian National Twin Register (ATR) with 2685 twin pairs, aged 28-73. Conduct disorder (CD) symptom is measured by the SSAGA. (test-retest r=.76-.83 for age<15 and r=.67-.78 for age<18). The 13 CD symptoms were aggregated into lifetime. Environmental similarity is assessed with the usual 4 items + 1 item about current frequency contact. Two indexes of twin similarity for CD were computed: the proband-wise concordance and the tetrachoric correlation. Using logistic regression to control for zygosity, sex, and age, they found that 2 out of the 5 items of environmental similarity were significant predictors of twin concordance for CD, but the 3 remaining measures had somewhat large p-values of .02, .03, .03. When they compare the same-sex twin correlations stratified by similarity of experience, the difference among either MZ or DZ group was often very large, but once again the p-values (although often significant) are suspiciously close to .05. Furthermore, they did not incorporate this twin environment (as total score) into their ACE model (AE being their best-fit model) to check the robustness of the heritability estimate.
Eisen et al. (1998) use 1869 MZ and 1490 DZ pairs from the VET Registry. Twins were also given 3 gambling-related questions. Those who answered Yes to all items had to complete 9 items signaling the 9 symptoms of pathological gambling according to DSM-III-R criteria. To measure environmental similarity, each twin is asked whether he thought he and his brother were MZ or DZ twins. They found no significant difference between twins who correctly or incorrectly perceived their zygosity and their correlation for reporting one or more symptoms of pathological gambling.
Carmelli et al. (2000) use a subgroup of the NHLBI Twin Study, comprising 83 MZ and 84 DZ male pairs who took the 20-item CES-D (α = .90), which measures depressive symptoms. They found no significant relationship between frequency of intrapair contact and similarity on depression symptoms (r = .01).
Klump et al. (2000) assessed the 30-item Eating Disorder Inventory (EDI), using 338 female twin pairs (aged 17.46) in the MTFS. Factor analysis identified 4 subscales. The EDI total score and the 4 EDI subscale scores in within-pair absolute difference are used as the outcome variable. Physical similarity was assessed using two methods: a “Physical Size Index” (PSI) which is the sum of the absolute value of the standardized within-pair difference for BMI and body shape ratings, as well as the ratings of twin photographs by two research assistants (interrater reliability of r=.77, two week test-retest of r=.96, and stability statistic of r=.70). MANOVAs revealed no significant differences between the similarity based on photographs and the differences in either the EDI total score or its subscale scores. The correlations between PSI and the differences in either the EDI total score or its subscale scores are generally very small and non-significant for both the MZ or DZ groups (often negative for MZ and positive for DZ).
Cronk et al. (2002, Table 4) recruited 1093 MZ and 855 DZ twins (age = 14.8) drawn from a population-based sample of female twins born in Missouri. Parents completed the Diagnostic Interview for Children and Adolescents, which measures 4 scales: Separation Anxiety Disorder (SAD; α=.77), ADHD (α=.89), Oppositional Defiant Disorder (ODD; α=.84), and Conduct Disorder (CD; α=.71). Environmental similarity is measured with 4 questions (perceived zygosity, shared friends, same classes, same dress) completed by the mothers. The ACE model was applied to SAD, ODD and CD because rDZ>½rMZ whereas the ADE model was applied to ADHD because rDZ<½rMZ. The parameter estimates of A and C in ACE or A+D in ADE differed very little before and after controlling for environmental similarity, validating EEA. Overall, heritabilities were very high and shared environments very small.
Jacobson et al. (2002) use same-sex twin pairs (298 MZF, 199 DZF, 642 MZM, 433 DZM) of age 13.5-14 from the longitudinal VTR. Childhood antisocial behaviour (AB) is a composite score of 11 twin questionnaires. Environmental similarity is a composite score of 4 items (same room, classroom, friends, dressing alike) that is averaged across twins. Their regression uses similarity of childhood environment as predictor of within-pair differences in childhood AB once zygosity was controlled for. Although they did not report the parameter estimates, the environmental variable was not a significant predictor for either females (p=.45) or males (p=.64). There was also no sex by zygosity interaction in childhood environment.
McCaffery et al. (2003) gathered 120 MZ and 114 DZ twins from the NHLBI study who all took the 20-item CES-D which assesses depressive symptoms. The twins also completed questions about lifetime and current smoking status. A regression was conducted using either frequency of contact or degree of closeness as predictor of the absolute within-pair differences in depression and smoking behavior, independent of zygosity. The coefficient was in all cases p>.10.
Romanov et al. (2003) use 9947 twin pairs (aged 33-60) from the Finnish Twin Cohort. The 21-item Beck Depression Inventory (BDI) is used as outcome. A regression using frequency of contact as predictor of degree of discordance for depression showed coefficients close to zero for both MZ and DZ groups.
Kieseppä et al. (2004) examined the Finnish Twin Cohort. Twins diagnosed with bipolar I disorder were identified through the family data compiled by the National Population Register. Their results read as follows: “The mean length of cohabitation was 3 years longer (z=–2.57, p=0.01) among the monozygotic than the dizygotic twins, and the frequency of contacts in adulthood was higher (z=–2.95, p=0.003). However, no association was found between affection status and either the length of cohabitation (N=38, p=0.66) or the degree of environmental sharing (N=50, p=0.17).”
Ehringer et al. (2006) evaluated 2750 individuals (aged 12-19), comprising twins and their siblings, from Colorado Twin Registry (CTR). Past year and lifetime symptoms were assessed by the structured interview DISC-IV which measures ADHD, conduct disorder (CD), oppositional defiant disorder (ODD), generalized anxiety disorder (GAD), separation anxiety disorder (SAD), and major depressive disorder (MDD). They compared a series of constrained models versus the full ACTE model. In all cases, the twin effect (T) could be dropped. For ADHD, CD, ODD, and SAD, the best model was always AE. For GAD, the best models were AE for past year and CE for lifetime symptoms, respectively. For MDD, the best model was always CE.
Kendler et al. (2006) examined 42161 twins in the Swedish Twin Registry. Twin environment is assessed at childhood (years living together) and adulthood (contact and meeting frequency). Major depression was measured with the CIDI-SF. A logistic regression (based on same-sex pairs) while controlling for zygosity and sex, both measures of twin environment were non-significant predictors of lifetime depression. Frequency of current meeting was a significant predictor but explained only 0.2% of the total variance in their genetic model.
Mazzeo et al. (2010) used 614 MZ and 410 DZ pairs in the VTR. Bulimia nervosa is assessed using items adapted from the Structured Clinical Interview for DSM-IV. Twin environment (childhood and adolescence) is measured using 7 items. The factor score of these items is used as moderator in an ACE model. Dropping the moderator does not worsen the model fit of the ACE. Heritability and non-shared environment accounted for 62% and 38% in the full model.
Meier et al. (2011) analyzed 2637 MZ and 3746 twin pairs (aged 29.94) in the Australian Twin Registry (ATR). Both childhood conduct disorder (4 items; 4-year test-retest r= .75) and adult antisocial behavior (7 items; 3-month test-retest r= .75) are based on structured diagnostic telephone interviews. Similarity of childhood environment is the sum score of the usual 4 questions. A logistic regression which uses twin environment to predict concordance for childhood conduct disorder (controlling for zygosity) produced conflicting results, with OR = 1.20 (CI = 1.00, 1.44) for females and OR = 0.78 (CI = 0.64, 0.96) for males. For adult antisocial behavior, results may violate EEA, with OR = 1.22 (CI = 1.05, 1.41) for females and OR = 1.14 (CI = 0.96, 1.36) for males.
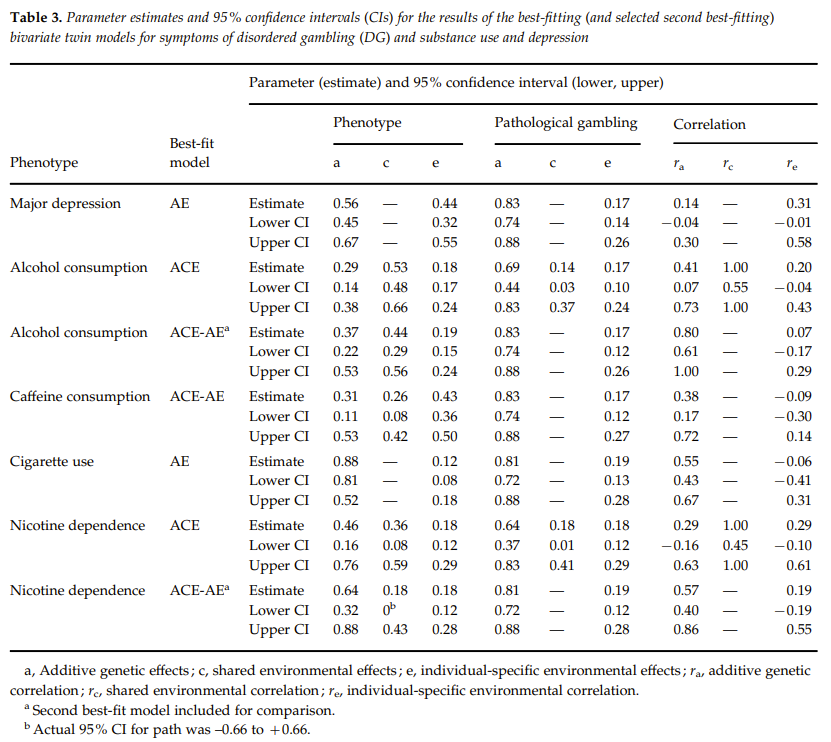
Blanco et al. (2012, Table 3) collected a web-based sample of 43799 individuals, including 609 twin and 303 sibling pairs. Gambling frequency is measured with the item “how many times have you gambled”, symptoms of disordered gambling (DG) with Stinchfield questionnaire, lifetime major depression with an instrument utilizing DSM-III-R criteria and nicotine dependence with Fagerstrom Test, lifetime heaviest cigarette use and alcohol use each with 2 items, caffeine consumption with 2 items. In the univariate model for either gambling frequency or DG symptoms, twin environment could be dropped, and the heritabilities were 32% and 83% respectively. In the bivariate models for DG symptoms and either one of the other phenotypes, the twin environment parameter was never needed, the best model was either ACE or AE, and the heritabilities were usually high for the other phenotypes.
LoParo & Waldman (2014, Table 3) use a sample of 885 twin pairs born in Georgia. Environment similarity is an average score based on 7 closeness questionnaires. The outcome variables, based on mothers’ ratings of the Emory Combined Rating Scale, include 4 externalizing symptom scales such as inattention, hyperactivity-impulsivity, oppositional defiant disorder (ODD), and conduct disorder (CD) with Cronbach’s alpha of .95, .89, .91, .82, respectively. Their regression analyses showed no interaction between either one of these externalizing symptoms and environment similarity. The R² was extremely small and not even significant for either the MZ or DZ twins.
Herle et al. (2016) examine 816 families with opposite-sex twin pairs, and 1586 with same-sex twin pairs from the Gemini data, sampling twins born in England or Wales. Parental beliefs about zygosity were assessed at 8 and 29 months old. The outcome is measured by the Baby Eating Behavior Questionnaire (BEBQ) at 8 months, which contains 4 scales, and Child Eating Behavior Questionnaire for toddlers (CEBQ-T) at 16 months, containing 6 scales. Overall there was no difference in magnitude between the size of the ICCs for correctly and misclassified MZs for any of the eating behaviors and at either 8 or 29 months old.
Nikstat & Riemann (2020) examine 3087 twin families from TwinLife. Internalizing (INT) and externalizing (EXT) problem behaviour were measured with the 4-subscale Strengths & Difficulties Questionnaire (ω=.70 for INT; ω=.63 for EXT) and adjusted for age/sex effects. They fit a multi-group model with cohort age (11, 17, 23) and zygosity as grouping variables. For INT the best model specified group equality across ages, no dominance, and no cultural transmission, yielding heritability and twin effect of 32% and 12%. For EXT, the best model specified no cultural transmission, no sibling and no twin environment, yielding additive and non-additive genetic effects of about 20-25% and 11-18%.
-
EEA: Smoking, drug, alcohol
Kaprio et al. (1987) recruited 879 MZ and 1940 DZ pairs (aged 24-49) from the Finnish Twin Cohort. Outcomes used are: frequency and quantity of alcohol and frequency of passouts. The regressions use co-twin’s drinking, age, zygosity, social contact, and their interactions, as predictors of twin’s drinking. EEA is clearly violated but heritabilities for these variables are still close to 40%.
Rose et al. (1990, Table 3) use the same FTC data and variables as in Kaprio et al. (1987). They extend the ACE model by specifying a common environment indexed by social contact, denoted sc², which in turn affects the proportion of twin covariance. The most parsimonious standard ACE drops C, producing h² and e² of 45% and 55%. The adjusted ACE model, which considers social contact, produces h², sc² and e² of 41%, 17%, and 42%.
Heath et al. (1989a) examined data of 1984 female twin pairs from the Australian Twin Register (ATR). The twins are asked to report their consumption of beer, wine, spirits or sherry, in standard drinks, for each day of the preceding week, as well as their frequency of social contact. In 3 twin groups (young MZ, young DZ and older DZ) they found no significant correlation between absolute intrapair differences in alcohol consumption and amount of social contact but they found a small correlation (.09) for older MZ women.
Prescott et al. (1994) recruited a large sample of older twins through a newsletter published by AARP. Outcomes are repeated measures of lifetime alcohol abstinence and past year consumption quantity and frequency. Twins are also asked about their frequency of in-person or telephone contact. The same result holds for all 3 outcomes. MZ correlations are higher with more frequent contact but the DZ correlations do not differ in a consistent way with frequent contact.
Heath et al. (1997) examine an Australian Twin Registry, using 2685 pairs aged 43-45. Lifetime alcohol dependence (according to DSM-III-R criteria) is assessed via a structured diagnostic interview, the SSAGA (test-retest r=.77). The twin pair tetrachoric correlations are computed separately for pairs (MZF, MZM, DZF, DZM, DZOS) with similar versus dissimilar early childhood environments, and with high versus low social contact. They found that only a single significant difference was found out of a total of 20 comparisons.
LaBuda et al. (1997, Tables 3-4) examine the impact of twin closeness on alcohol dependence (130 pairs) as well as non-alcohol drug abuse/dependence (85 pairs) based on the Diagnostic Interview Schedule (DIS). Sample drawn from Minnesota. Closeness is measured using the overall score by summing proband and co-twin responses to 8 items, as well as factor score of contact scale and emotional closeness scale derived from an orthogonal factor analysis. Their logistic regression shows that the odds ratio of closeness summary and factor scores for either co-twin risk of alcohol or drug abuse is generally small, with a value greater but close to 1. The co-twin risk among MZ twins was higher than among DZ twins, but the difference remained significant even after controlling for sex and closeness score.
Kendler et al. (1997) analyzed 8935 twin pairs from the Swedish Twin Registry. 14.1% of these twins registered with the Temperance Board (TB). Drunkeness was the most common reason for registration. Alcoholism is obtained through a hospital diagnosis of alcoholism or alcoholic psychosis. Questionnaires contain information on levels of alcohol consumption. Twins with more contact frequency were slightly more similar in their probability of TB Registration. Tetrachoric correlations for TBR in MZ and DZ twins, respectively, were: low contact, 0.61 and 0.39; intermediate contact, 0.67 and 0.49; and high contact, 0.66 and 0.46. The fit of the ACE model is not improved by adding the “frequency of contact” parameter. If this parameter were included, it accounted for 8% of the variance in liability to TBR.
Prescott & Kendler (1999) use a sample of 3516 male twins (age=35.1) from the Virginia Twin Registry (VTR). Lifetime alcohol abuse/dependence were assessed by structured interview to permit evaluation of DSM-III-R-defined and DSM-IV-defined diagnoses based on 4 questions. Environmental similarity is measured with the usual 4 items at childhood and 2 items at adulthood. Logistic regressions are used to predict pair concordance for diagnosis from zygosity and the interaction of zygosity with each environmental measure. Of 24 tests conducted (4 diagnoses multiplied by 6 predictors), they found one significant effect.
Kendler et al. (2000a) examine illicit substance use based on data from 1198 male-male twins (708 MZ and 490 DZ) aged 20-58, using Wave 1 & 2 of the VTR. Outcomes include lifetime use, heavy use, abuse, and dependence of 7 substances (cannabis, sedatives, stimulants, cocaine, opiates, hallucinogens, or any) which are measured using the Structured Clinical Interview for DSM III-R. Test-retest reliabilities are high for drug use and heavy use (r>.90 for all) and drug abuse and dependence (most r>.80-.85). Childhood environmental similarity was assessed via several items, but adult environment with a single item about frequency of contact. In their full ACE models, the correlated environment accounts for 7% of variance in liability to substance use. In all but one of these models, this correlated environmental factor could be set to 0 with an improvement in the model’s AIC.
Xian et al. (2000) analyze the Vietnam Era Twin (VET) Registry, using 3155 male-male twin pairs (age = 44.6 years), for the following lifetime disorders: alcohol dependence, marijuana dependence, any illicit drug dependence, nicotine dependence, major depression, and posttraumatic stress disorder. These psychiatric disorders are derived from the Diagnostic Interview Schedule. Self-perceived zygosity was used as the specific family environment to test EEA. This specified environment was added to the standard ACE model, hence now an ACCE model. The full ACSCRE was compared to the submodel ACRE model and the ACSE model to its submodel AE, using likelihood-ratio χ2 and AIC. No significant deterioration in fit was found by setting CS to zero for all disorders. AE model was superior for almost all disorders. However, their measure of specified environment is not the best one could use.
Horwitz et al. (2003, Table 3) use 406 same-sex twins with complete data from the Add Health. Outcomes include BMI, depression (CES-D), trying alcohol (1 item), drinking frequency (1 item), frequency of binge drinking (1 item). Social environment is measured with 3 items (difference in time spent together, in same friends, in best friends who drink). These environmental variables, along with zygosity are used as predictors in a regression. These social environmental variables predicted trying alcohol, while only the best friends variable predicted alcohol outcomes. EEA is only rejected for drinking.
Rhee et al. (2003, Table 4) analyzed 345 MZ and 337 DZ pairs, 306 biological and 74 adoptive sibling pairs from Colorado (CTR and CAP, respectively). Outcomes are measured with 1 item: substance initiation, lifetime use and dependence symptom for tobacco, alcohol, marijuana, any drug. The twin-(adoptive)sibling data allows them to fit an ACDTE model, since C and D are no longer confounded. The AE/ACE models had the best fit in most cases. The twin effect (T) is generally very small (CI includes zero) and the only consistent pattern is for lifetime use of alcohol, marijuana and any drug where T is large. Heritabilities for all variables are also quite high.
Lessov et al. (2004) examine a very large twin sample from the Australian twin panel (aged 24-36). Outcome includes nicotine dependence (7 items) and heaviness of smoking (2 items). They conducted an ACE model but separated their sample into 2 groups, those who reported always sharing the same friends versus less often. They found no differences in estimates of genetic and shared environment.
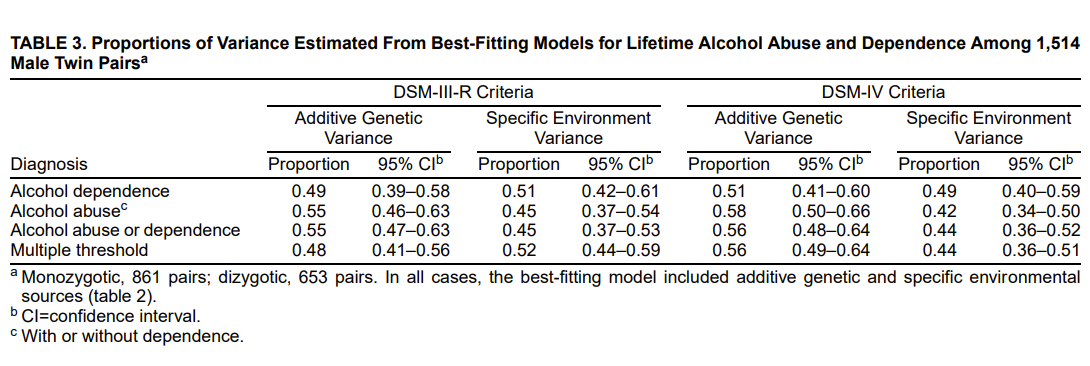
Penninkilampi-Kerola et al. (2005) studied cotwin dependence using a large twin sample from the Finnish Twin Cohort. The reason it matters is because cotwin dependent twins were more often contacting each other and living together than cotwin independent twins. If heritability differs between these two groups of twins, this would indicate that EEA does not hold. The twins were asked 4 questions: whether they are dependent on their cotwin, about their drinking frequency, about their abstinence, about their intoxication frequency. Two variables are used as covariates: urban/rural residential status and religiosity. They fit an ACE model that allows the parameters to vary between cotwin dependent and cotwin independent twins, as well as between sexes. Models are fitted for adolescent (aged 16) and adult (aged 22-27) samples separately. Among adolescents, none of these alcohol variables showed group equivalence, as the heritability was consistently close to zero for cotwin dependent twins but modest for cotwin independent twins. Among adults, abstinence and drinking frequency showed modest heritability and group equality holds. EEA is rejected for adolescents but not adults.
Rende et al. (2005) examine the Add Health (Waves 1-2), using 256 MZs, 219 DZs, 547 full siblings, 165 half-siblings, 146 unrelated siblings. Outcomes include smoking (1 item), drinking (5 items). Sibling relationship was assessed via a single item about social contact and mutual friends. Their extended DeFries-Fulker regression is stratified by high versus low levels of sibling contact and mutual friendships (dichotomy of highest level versus all other levels), respectively, as well as statistical tests of differences based on stratification after controlling for age, age differences, and gender. When examining both the mean and confidence intervals of the estimates, heritability is not affected by either sibling contact or mutual friendship but shared environment is consistently much higher when either contact or friendship is high.
Hamilton et al. (2006, Table 5) use a very large adult sample from the California Twin Program. The two outcomes are measured using twin’s self-report and report of the co-twin: “have you smoked at least 100 cigarettes in your life” and “have you smoked in the last 6 months”. Frequency contact is a single measure that is dichotomized for use in a moderated ACE. For ever smoked, the parameters were fixed to equality across sexes, h² was 51.3% for both close and distant twins but c² was 18.8% for close twins and fixed to zero for distant twins. For current smoking, h² and c² were 25.7% and 55.7% for females and 55.3% and 31.1% for males among close twins but h² and c² were 60.2% and 14.1% for both sexes (i.e., equality constraint) among distant twins.
Young et al. (2006, Figures 1-2) analyzed a large sample of twins and their siblings, aged 12-18, from the Colorado Twin Registry (CTR). Substance use and problem use are measured using the diagnostic interview CIDI-SAM. Reliability seems low, as evidenced by the rMZ for tobacco (r = 0.59), alcohol (r = 0.49), and marijuana dependence (r = 0.37). Their trivariate analysis of tobacco, alcohol, and marijuana use compared the ACTE model with submodels. For substance use, the heritability for tobacco and marijuana use is high but very small for alcohol use, the effects of c² and e² were moderate for all substances, but the twin effect t² was large for all substances, with moderate shared correlations across these t² factors. For substance problem use, the heritability was very high for all substances, the effects of c² and t² and e² were moderate, and there were no shared correlations across the c² factors or across the t² factors. Thus, EEA holds for substance problem use but does not hold for substance use.
Morley et al. (2007) analyzed 5321 twin pairs and 3715 siblings from the ATR. Outcomes are single-item measures: smoking age-at-onset, average daily cigarettes, smoking persistence (ex- or current smoker). Their multivariate ACTE model was fitted for all 3 outcomes measures, but parameters could not be equated across genders without worsening the model. In the full model, which fitted best, the twin environment was only large for smoking age-at onset (.12 for males and .19 for females) and the heritability was large for smoking onset (.60 and .62), daily cigarettes (.40 and .41), and smoking persistence (.50 and .41).
Boardman (2009) used a sample comprising MZs (N=248), DZs (N=378), full (N=1066) and half siblings (N=368) aged 16.42 in the Add Health, Wave 2. Dependent variables are single questions about smoking onset and daily smoking. The analysis involves a multilevel sibling/twin regression, where the level 1 is equivalent to the DeFries-Fulker model (sibling 1 smoking regressed onto: sibling 2 smoking and genetic similarity and their interaction) and level 2 is an environment variable used to test for moderation effect, i.e., G×E interaction, in this case state-level variance. When the models are adjusted for the proportion of friends that the sibling pairs had in common, the parameter estimates did not change.
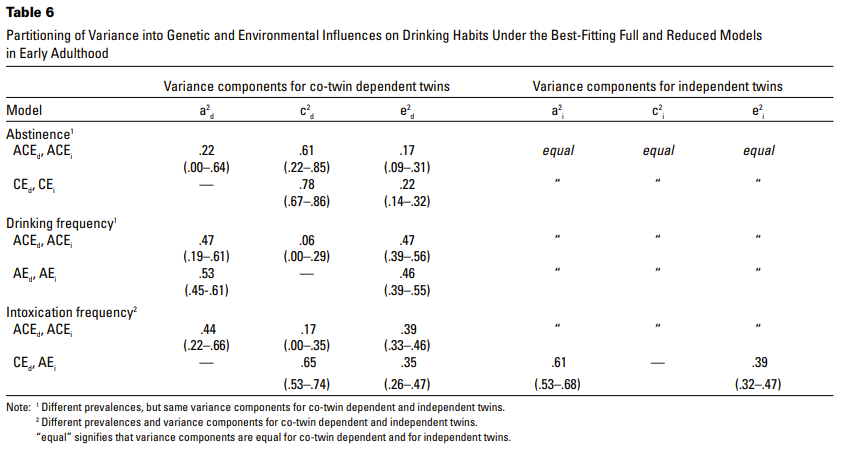
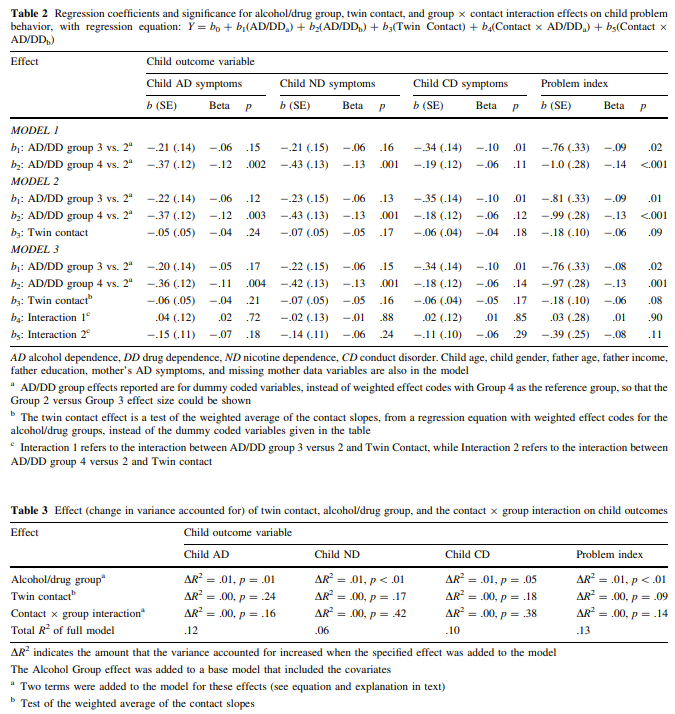
Koenig et al. (2010) analyze 739 twin pairs from the Family Twin Studies, answering how problem behaviour among children of MZ/DZ twins is affected by cotwin contact among twins affected by alcohol and drug dependence compared to other (unaffected) groups of twins. Cotwin contact is measured with 2 questions. The logic of their method, based on Children of Twin (CoT) design, is explained as follows: “Given MZ twins who are discordant for a given phenotype, such as alcohol dependence (AD), only one member of the pair (the one with AD) will also contribute to a child’s environmental risk; that is, the children of only one of these twins will grow up in a family with an alcoholic father. In these families, the children who have an alcoholic uncle but an unaffected father have the same genetic predispositions to alcohol abuse as their cousins, but unlike their cousins, they do not experience the environmental impact of growing up with an alcoholic parent. … If more frequent twin contact is associated with more problems in the children, and this contact differs by zygosity, the EEA would be violated.”
They use 3 twin groups: affected MZ co-twin, affected DZ co-twin, and control twins. They found that affected twins had more contact with each other compared to other groups, but the regression analysis showed that neither the contact nor contact*group interaction were significant in predicting alcohol dependence, or nicotine dependence, or conduct disorder, or the total score of these 3 variables. Covariates used were: child gender, child and father age, father’s years of education, mother’s AD symptoms. The standardized coefficients often range between 0.00 and -0.10. Separate regressions of each child problem behavior variable on the covariates and the drug/alcohol status showed non-significant coefficients for drug/alcohol status, confirming the absence of selection bias in the affected co-twin groups.
Kendler et al. (2014) obtained large samples of twins and siblings from the Swedish nationwide registry data. Drug abuse was defined using public medical, legal, or pharmacy records. Their best fit model is one that allows sex differences in the parameters and removes shared (c²) and twin shared (t²) environments for females. In this model, heritability accounts for 55% in males and 73% in females, while t² accounts for 3% in males. Among full and half-siblings, years of cohabitation predicted a higher concordance for drug abuse in all sibling groups.
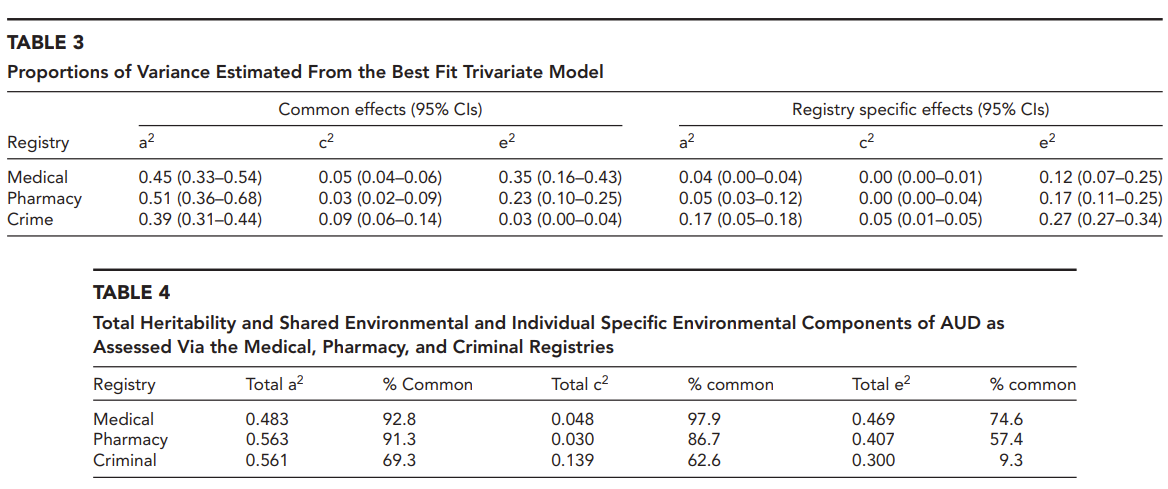
Kendler et al. (2016) obtained very large samples of twins and siblings from the Swedish Twin Registry and Multi-Generation Registry. Alcohol use disorder was obtained using three different registries: medical, pharmacy, and crime. Their best model is an ACTE that allows genetic correlations to vary across sexes. Genetic (A) and twin special (T) effects account for 22% and 29% among females and 57% and 2% among males.
Bares et al. (2017) examined 3078 individuals (twins and siblings) in the Add Health, aged 12-17 and 26-33 during the first and last wave. Outcome is the single item “have you ever smoked a cigarette”. Separate biometric models were fitted for each age group. They selected the ACTE model with sex differences in parameters as the best fitting for each group. For the age groups 12-17, 18-25, 26-33, heritabilities were 11.5%, 68.8%, 65.6% and twin effects were 6.8%, 0.0%, 5.0%.
Maes et al. (2018) conducted two studies, one using “Virginia 30,000” from the formerly VTR, one using “Australian 25,000” from the ATR. Both data contain a large sample of the twins’ family, including their parents, siblings, spouses and children. All participants in both studies were asked: 1) about their frequency of smoking habits, 2) daily cigarette consumption, 3) age at which they started smoking. Based on these 3 items, they created a dichotomy “ever smoked or not”. Twin family data allows the estimation of ACDE along with assortative mating, cultural transmission, twin environment, G-E covariance. Both US and Australian samples were combined as the fit did not deteriorate. Model fit indicated that cultural transmission could be fixed to zero. Dominance was close to zero and G-E covariance negative. Under the model without dominance, heritability was high for men (53%) and women (55%) despite violation of EEA. Indeed, the twin environment t² was 9% for men and 15% for women.
Verhulst et al. (2018, Table 3) use the same datasets and analyses as Maes et al. (2018) above. There are 4 outcomes, all measured with 1 item: drinking quantity, drinking frequency, age at first drink, number of drinks last week. The twin special effect is generally close to zero across samples and gender groups, with the exception of age at first drink displaying a large twin effect except for males in the Australian sample. For age at first drink, heritability is generally zero; for other variables, the dominance effect is often modest among females but because the additive effect is typically zero this cannot be trusted; for all outcomes, the estimated e² is large. Given how the outcome is measured, the combination of large e² and the low h² is likely the result of measurement error.
-
EEA: Personality
Plomin et al. (1976) conducted independent 2 studies, both examining four personality traits: Emotionality, Activity, Sociability, and Impulsivity (EASI) completed by the mother in the first study and by both parents in the second study. Families were recruited from Mothers of Twins Clubs. The first and second study used the 20-item EASI and 56-item EASI, and their respective test-retest reliabilities were .83 (at 1 month gap) and .72 (at 2-3 month gap). First study includes 95 twin pairs (aged 2-6). Second study includes 111 same-sex twin pairs (aged 2-6). The samples did not overlap despite their similarity. A confusability score was obtained via the sum score of 4 items measuring how often the twins were mistaken by parents and friends. Correlations between confusability and within-pair differences in personality dimensions vary in magnitude (very small, modest and somewhat large) but there are two observations: in the first study all correlations for MZ pairs were negative and all correlations for DZ pairs and all pairs were positive, whereas in the second study the large majority of the correlations for either group is positive. The EEA is rejected only in the first study for MZ pairs, since increased confusability (i.e., resemblance) scores would reduce MZ differences in personality in the first study.
Cohen et al. (1977, Table 3) examine 377 twin pairs (mean age = 35.5 months) in families recruited from the Mothers of Twins Clubs. Social confusion was measured with 4 items. Both parents completed a question about parenting style as well as the 48-item CPS. 5 factor scale scores were extracted from a factor analysis of the CPS: attention, behaviour modulation, sociability, zestfulness, emotional expressiveness. With respect to EEA, the authors reported: “To examine hypotheses about the way in which degree of physical similarity may relate to the behavioral assessments, twinships were contrasted on the basis of scores on the discriminant function used to determine zygosity. A low function score indicates major dissimilarity in physical appearance and little likelihood of social confusion. Dizygotic twinships with low function scores had relatively higher difference scores on the CPS behavioral dimensions than DZ twinships with higher function scores. This relationship did not hold for MZ twinships. Among identical twins, there was no systematic relationship between the degree of physical similarity and social confusion and the degree of similarity in behavior.” The intraclass correlations for CPS factor scores of MZs perceived as MZs, or perceived as DZs, or MZs with uncertain zygosity, are generally similar when using either parent’s ratings. The authors noticed that parents’ perceptions influence the development of children’s sex differences due to parenting style differences. This indicates that EEA should be tested using same-sex twins.
Phillips et al. (1987, Tables 6-7) collected a family data comprising 250 adult same-sex twin pairs, 91 same-sex siblings, and their parents, in Indiana. Outcome is based on the 51-item Fear Survey Schedule II, yielding 7 scaled scores based on factor analysis. In their multivariate model, only the parental transmission paths and common sibling environment could be fixed to zero. The single factor structure could be applied to the genetic correlation matrix, but not to the phenotypic correlation matrix or even the environmental correlation matrix without fit loss. This suggests common genetic factors but not common environmental factors. For social criticism, water, dangerous places, health, social responsibility, heights, morbid settings, heritabilities were .22, .20, .39, .30, .19, .22, .34 and their genetic correlations very high, while the twin environment effects were .31, .33, .17, .29, .31, .25, .14 but their environmental correlations small and sometimes close to zero.
Rose et al. (1988) analyzed 7144 twin pairs (aged 24-49) from the Finnish Twin Cohort (FTC). Neuroticism (10-item) and extraversion (9-item) are measured using the EPI. For both MZs and DZs and for either outcome, the intraclass correlations at later age of separation (17-24 years old versus <17) were higher by around +.10 although at varying degrees.
Kaprio et al. (1990) use a sample of >550 MZ pairs aged 18-25 from the same FTC. Outcomes include neuroticism and extraversion scales from the EPI, and questionnaires about alcohol consumption, all measured at baseline and follow-up. Environmental similarity is assessed with cohabitation status and frequency of social contact during follow-up. The intraclass correlations of alcohol and neuroticism among MZs do not differ by social contact at baseline but differ substantially at follow-up, while extraversion among MZs differ by social contact at both waves. They believe the analysis leaves the causal direction unresolved but that two mechanisms are at play: 1) decreasing social contact leads to decreasing twin similarity for alcohol and neuroticism, 2) lower resemblance leads to decreasing social contact for neuroticism.
Morris-Yates et al. (1990, Table 4) analyze 343 same-sex twins (aged 18-65) in the Australian Twin Registry (ATR). They excluded opposite-sex DZs to avoid sex role differentiation. The twins were given 12 items about similarity of childhood experiences, with subsidiary questions concerning how the twin would have preferred to have been treated. A factor analysis of these 12 items yielded two factor scores: imposed and elicited environment. The twins took the Eysenck Personality Questionnaire (EPQ), measuring neuroticism, and the Delusions-Symptoms-States Inventory (DSSI/sAD), measuring symptoms of anxiety and depression. There is a very weak correlation between the similarity of either imposed or elicited environment and the intrapair difference in neuroticism, anxiety, depression, and not always in the expected direction among MZs. The results support EEA, with one exception: the correlation between similarity of elicited environment and the intrapair difference in either outcome is consistently negative and modest among DZs.
Braungart et al. (1992) gathered small samples of infant twins (from LTS) and adopted and nonadopted infants (from CAP), all were aged 1-2. Outcome is the 30-item Bayley’s Infant Behavior Record (IBR). A factor analysis identified 3 scales: affect-extraversion, activity, and task orientation. Their ACDE models were fitted to the twin-sibling data, and further constraints revealed that the parameters could be equated across age, that C and D parameters could be dropped for activity and task orientation whereas the C parameter could be dropped for affect-extraversion. Heritabilities were 42% for affect-extraversion, 47% for activity, and 44% for task orientation. Models that allow parameters to differ between twins and non-adoptive siblings did not fit significantly better (i.e., no twin environment). One can argue that the non-significance is due to the small sample, however the correlations for DZs and non-adoptive siblings were very similar.
Roy et al. (1995) use 738 female twin pairs from the VTR data. Self-esteem is measured with the 10-item Rosenberg scale both in Wave 1 and 2. Childhood environmental similarity was assessed via several items, but adult environment with a single item about frequency of contact. Their regression includes zygosity and environmental similarity as predictors. They report: “Moreover, neither frequency of contact or similarity of environment significantly predicted similarity in self-esteem, which suggests that there was no major violation of the EEA.”
O’Neill & Kendler (1998) examine 2230 twin pairs from the VTR who were given the 10-item Interpersonal Dependency Inventory (IDI). A factor analysis of IDI identified 3 factors: emotional reliance on another person, lack of self confidence, assertion of autonomy. A regression using (adult) contact frequency and (childhood) environmental similarity as predictors of the within pair difference on IDI, controlling for zygosity, showed no impact of either predictor on IDI.
Goldsmith et al. (1999) use a sample comprising 302 pairs aged 3- to 16-months from various US states. Mothers completed the Infant Behavior Questionnaire for both twins. The internal reliabilities for each scales are: Activity Level = .81, Smiling and Laughter = .78, Duration of Orienting = .78, Soothability = .71, Distress to Novelty = .67, and Distress to Limitations = .81. They use different methods to check the twin study assumption. First, they emphasize that the means and variances of each scale are almost identical between MZs and DZs. Second, the correlation between the intrapair difference and normalized score for each scale was very high and identical for both MZs and DZs, indicating that the intrapair difference is normally distributed for both MZs and DZs as predicted by theory, which then implies that there is no biasing or contrast effect such as EEA violation that would act to lower the correlations among DZs. Third, the intraclass correlations for MZs thought as DZs (N=13) are generally lower than the intraclass correlations for MZs correctly thought to be MZs but there is no consistent pattern.
Bailey et al. (2000) analyzed 1891 twin pairs (median age, 29) in the ATR. Twin childhood environment is measured with the usual 4 items. There are 3 outcome variables: sexual orientation (sum score of the Kinsey sexual fantasy item and the Kinsey sexual attraction item), childhood gender conformity (CGN; 24 items, α=.79), continuous gender continuity (CGI; 7 items, α=.52-.57). Among males the correlations between twin environment and intrapair differences of each outcome were small and non-significant for both zygosities, but among females these correlations were not trivial in the MZ group for CGN (r=-.14) and CGI (r=.12) and in the DZ group for CGN (r=.13) and CGI (r=-.02).
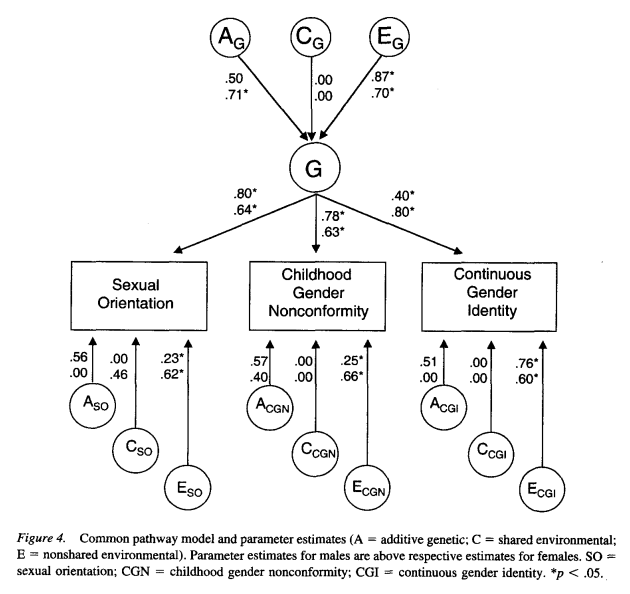
Jonnal et al. (2000) recruited 527 female twins from the VTR. Outcomes come from the 20-item Padua Inventory of obsessive-compulsive symptoms (OCS). A varimax PCA produced 2 factors, namely obsessiveness and compulsiveness, which were extracted and used in ACE models. Their results read as follows: “We tested the EEA for OCS by determining whether, controlling for zygosity, twin resemblance for compulsiveness or obsessiveness could be predicted by twin physical similarity, duration of cohabitation, adolescent cosocialization, or the frequency of contact during the period in which they were interviewed. Two of these eight analyses proved significant. Adolescent cosocialization was found to affect the similarity of MZ twins for obsessiveness and MZ and DZ twins for compulsiveness.”
Lake et al. (2000, Tables 3-4) use a large extended twin family data from the ATR and VTR. Outcome is the neuroticism scale score (12-item) of the EPQ. The scale score is adjusted for age, age², sex and their interaction prior to model fitting. The cultural transmission model could be fitted for both data simultaneously without fit loss, and a genetic model that excludes cultural transmission (including twin effect) does not fit worse than the full model. Genetic effects account for 42% and 35% among males and females, respectively, but account for 53% and 45% after controlling for measurement error.
Kendler et al. (2000b) use a large sample (aged 25-74) of twin and nontwin siblings from the MacArthur Foundation Midlife Development. Twin environment is measured with the standard items of environmental similarity plus the frequency contact. Sexual orientation was assessed with a single question. They use a logistic regression, with environmental similarity as predictor of concordance status of the twin pair for sexual orientation while controlling for zygosity. This predictor was not significant for either the similarity of childhood environment (p=.31) or adult environment (p=.12).
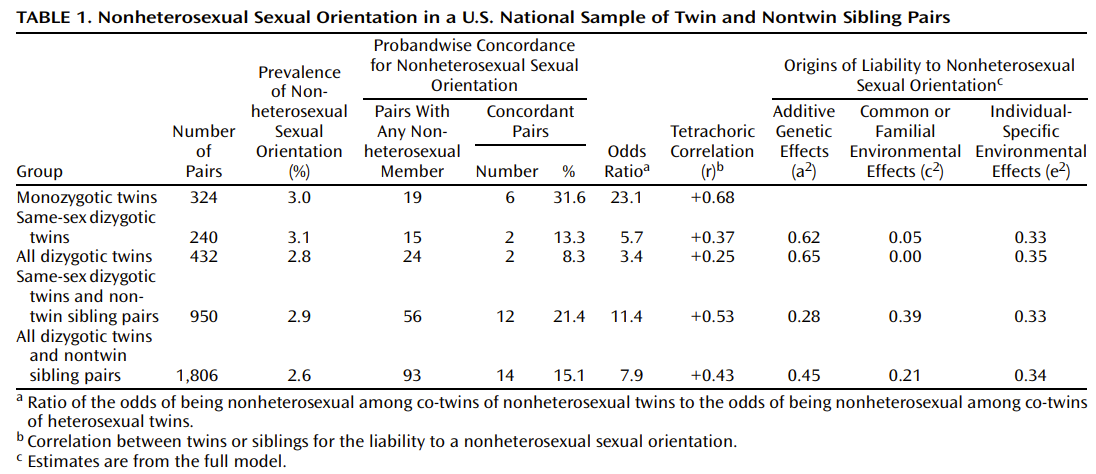
Borkenau et al. (2002) analyze the Big Five personality using the 60-item NEO-FFI (α=.71-.85 for the scales), based on 525 MZ, 200 same-sex DZ, and 68 opposite-sex DZ twin pairs from the German data of the Bielefeld-Warsaw Twin Study. Similarity in childhood treatment is measured with 10 items (reliabilities = .51-.90). Their regression model uses trait of twin 2, treatment similarity and their interaction term to predict trait of twin 1, for each twin pairs, for each of the 5 personality subscales, and for self-ratings and peer ratings of NEO-FFI separately. Their Table 3 indicates that the interaction term (treatment*trait) is predominantly positive when using all-twin sample, but positive regression coefficients were just as frequent as negative coefficients when using either MZ or DZ twin sample. Results replicate whether one uses raw scores or residualized scores controlling for age and sex, or self-ratings versus peer ratings. Their moderated regression which uses the trait of one twin to predict the trait of the other twin indeed avoids the unreliability of score differences from the intrapair difference method, but does not handle measurement error beyond this feature.
Hunt & Rowe (2003) analyzed a combined sample of twin and non-twin siblings (total N pair = 1421; age = 15.5) in the Add Health. Outcome is the timing of first sexual intercourse, adjusted for age. Social environment is measured using “time spent together” question. They used a moderated DeFries-Fulker regression by adding the environment variable, with all sibling pairs double-entered. For same-sex siblings (all pairs), heritability decreases substantially as the time spent together increases (from 41% to 10%). Although DF analysis rejects EEA, the observed DZ and full sibling correlations were so close as to suggest no special twin environment.
Wade et al. (2003) examine 884 twin pairs (aged 32.35) from the Australian Twin Registry. The twins were asked to report their zygosity, physical resemblance and mistaken identity. Outcome was measured with the 44-item Body Attitudes Questionnaire. Factor analysis of the BAQ identified 6 subscales: Feeling Fat, Body Disparagement, Strength and Fitness, Salience of Weight and Shape, Attractiveness and Lower Body Fatness. To evaluate EEA, they use a polychotomous linear regression with the intrapair twin difference in each of the BAQ subscale as outcome, as well as zygosity and, in turn, factor scores (co-socialization and childhood treatment) from five questions of environmental similarity as predictors. None of these factor scores predicted the twin similarity in any of the BAQ subscale (with unclear pattern for Lower Body Fatness).
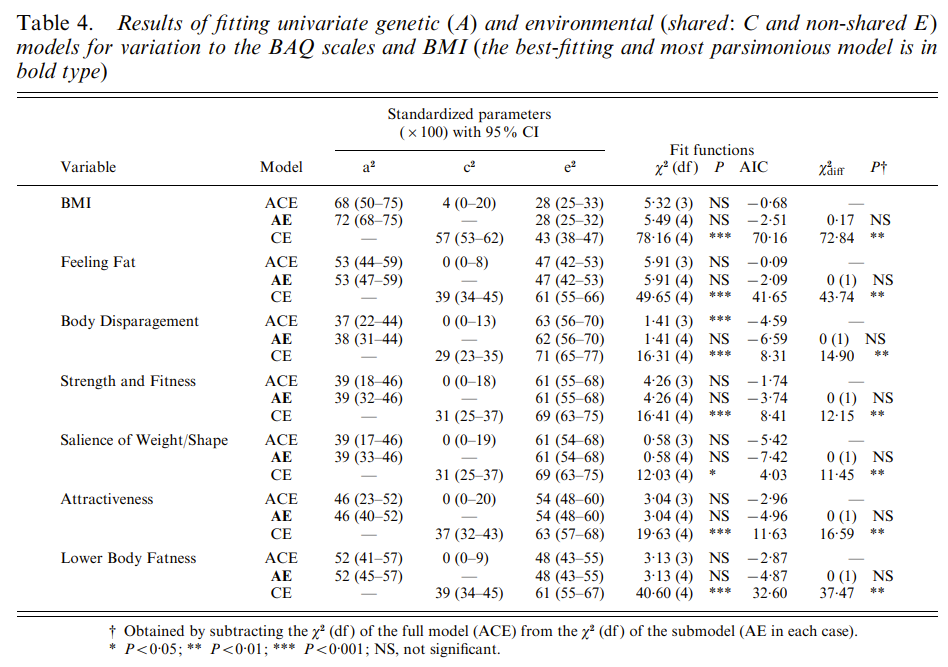
Keller et al. (2005, Table 5) obtained large samples of twins and siblings (aged 18-90) in the ATR. Eight personality dimensions were measured using the 48-item Eysenck Personality Questionnaire and the 54-item Temperament and Character Inventory. These scores are adjusted for age, birth order and sex. Due to rDZ < ½rMZ, ADE models (instead of ACE) were fitted for most variables. When corrected for unreliability with (A+D)/r where r is test-retest r, the broad h² values were large (.39-.57) but a great portion of h² was due to non-additivity, and sometimes additive effects were close to zero, probably due to the A parameter being poorly estimated. The twin effect t² was set to zero (due to non-significance) for six personality measures, and quite small when estimated.
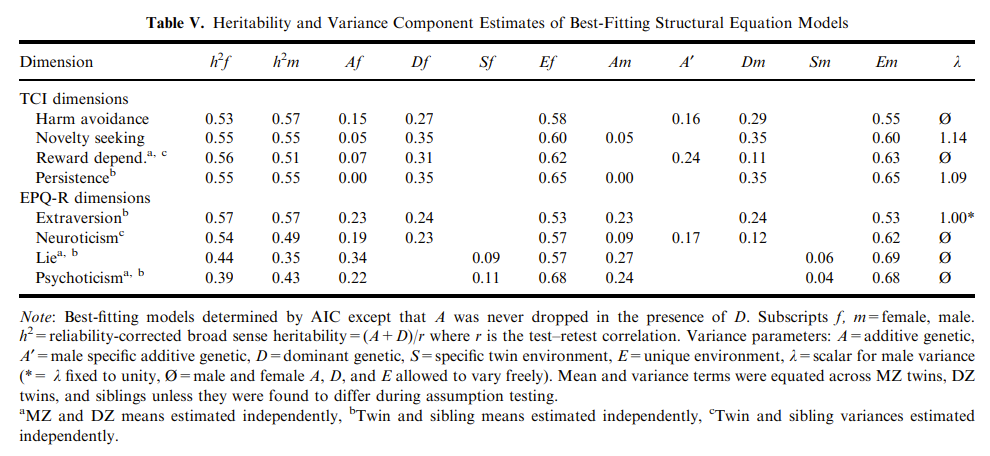
Tholin et al. (2005) examine 326 DZ and 456 MZ pairs (aged 26) from the Swedish Young Male Twins Register. Eating behaviour is measured using the self-assessed TFEQ which reflects 3 dimensions: cognitive restraint scale (6 items), emotional eating scale (6 items), and uncontrolled eating scale (9 items). Twins were also given a single question about contact frequency, which was then dichotomized to test EEA. The best genetic model for either eating behaviour scale was the ADE. They then perform stratified analyses by contact frequency, and the heritability differs by 0-8%. They did not report the sign of this difference.
Eriksson et al. (2006) studied the resemblance in physical activity (PA) among 1022 adult twin pairs in the Swedish Young Male Twins Study. The Baecke questionnaire is used to measure activity: leisure time activity excluding sport, occupational activity, sport during leisure time (as well as the total score of these items). Contact frequency is measured with a single question. They applied a series of ACE/ADE models. The AE model fitted best for all PA dimensions. EEA was tested based on data simulated for 20,000 MZ and 20,000 DZ twins using the AE model, and results indicate much higher heritability for twins with more frequent contact. This should violate EEA but according to the authors, “similar patterns of heterogeneity may arise due to genetic factors impacting on niche selection, e.g. the type of peer groups young people choose to join and spend their time with (Eaves et al., 2003).”
Weber et al. (2011) studied 3 different group identification (racial, ethnic, and religious identification) using 691 same-sex twin pairs from the MIDUS. For each identification, a factor score is derived from 3 items such as “how closely do you identify with your racial group”, “how much do you prefer your racial group”, “How important is it to marry within your racial group”. The logic of the method is that MZs should have identical scores on each factor score if they were assigned at random to the common environment (EEA). There is no difference in mean score in each factor between the MZ and DZ group. A logistic regression using a factor score as predictor of zygosity showed no significant coefficient for each identification.
Hahn et al. (2013, Table 2) use twin family data from the German socioeconomic panel (GSOEP), which includes twins, their other siblings, their mothers and grandfathers (N=2616). Outcomes include the 15-item Big Five Inventory-Short Form (each scale except agreeableness had α ranging between .60 and .71) as well as the factor score of life satisfaction (based on 5 items: household and personal income, health, housing, leisure). Such data allows multigroup genetic models which estimate the full ACDE model, along with cultural transmission and twin specific environment (EEA). Their models still assume the lack of assortative mating, rGE and G×E. For neuroticism and extraversion, all ACDE parameters could be constrained to equality for twin and non-twin groups, For conscientiousness, broad h² (A+D) was estimated at 74% for twins and 53% for non-twins. For life satisfaction, broad h² was equivalent between groups but C was estimated at 6% for twins and 32% for non-twins.
Matteson et al. (2013) use a combined sample of twins (984 MZ and 545 DZ, aged 18) from the MTFS and siblings (204 biological and 405 adoptive, aged 17) from the SIBS. Personality was assessed with the 198-item MPQ for ≥16 yrs-old and with the 133-item PBYA for <16 yrs-old. The resulting 11 scales and 3 higher-order factor scores are adjusted for age and sex for twins and non-twins separately prior to model fitting. The advantage of a twin-(adopted)sibling design is the ability to reliably separate the C and D parameters. An ACE model which constrains the parameters to be equal between twin and adoption samples did not decrease model fit for any scales (except one), and produced a² ranging from .40 and .50, and c² typically close to zero, and the twin effect t² zero for all scales. When fitting an ACDE model, much of the heritability was due to dominance, with additive effects generally weak (non-significant). The authors noted: “However, as Keller and Coventry (2005) pointed out, A and D are highly negatively correlated which makes their estimates imprecise when both are included in the model, and it is biologically implausible for dominance effects to exist without additive effects.”
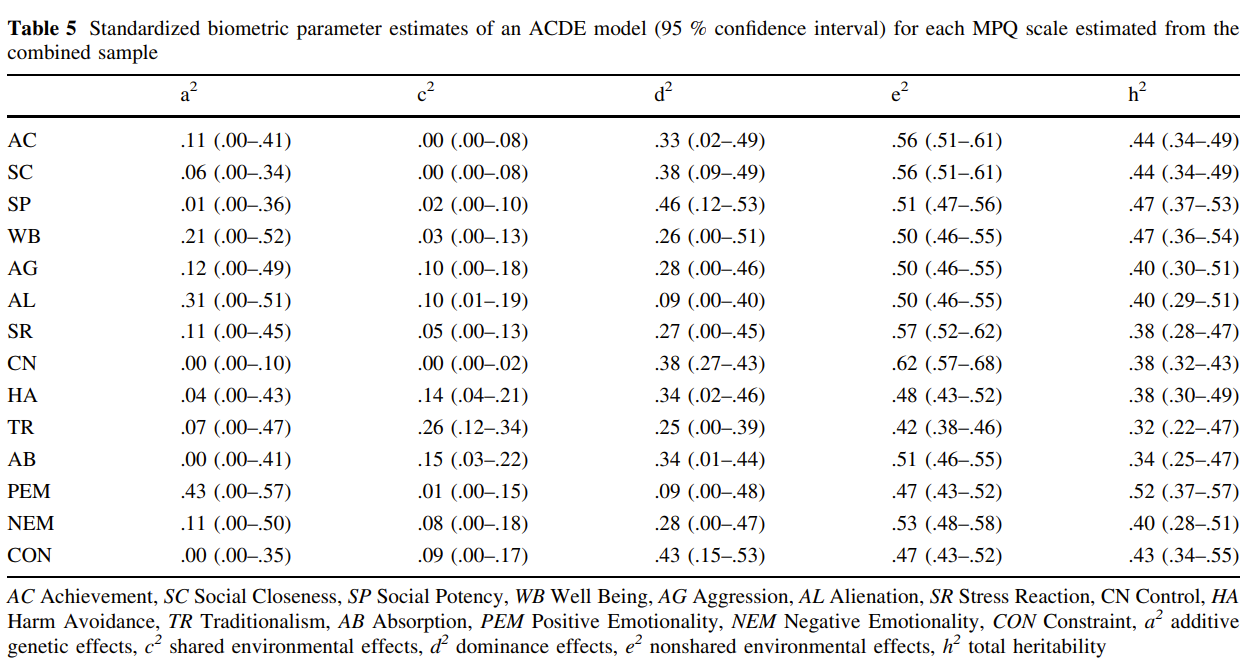
Bleidorn et al. (2018, Tables 5-6) applied a twin family design on the TwinLife data, using 4000+ twin families. Outcome is the short-form of Rosenberg Self-Esteem Scale (3 items), corrected for age/sex differences. Baseline models dropped either dominance or sibling environment. Dropping sibling environment (instead of dominance) fitted better, and further dropping assortative mating and maternal transmission did not improve model fit. The variance accounted for by additive, non-additive genetic, twin and non-shared environment effects are 25%, 9%, 5%, 62%, respectively. Passive rGE was small but negative.
Klassen et al. (2018) applied a twin family design on the German TwinLife data, using 4000 same-sex pairs (cohort age = 17 and 23) and their siblings and parents. Outcome is achievement motivation using the sum score of 2 items (α around .60-.65). Their models sequentially drop sibling environment, parental transmission, and finally twin environment. Dropping the twin parameter worsens the model fit. There were no cohort differences in the parameters, no effects of assortative mating or passive rGE. In the best model, additive genetic, epistasis, twin-specific and non-shared environment effects account for 17%, 13%, 8% and 62%, respectively. The authors noted these estimates are consistent with CTD studies, but h² is under-estimated due to poor measurement.
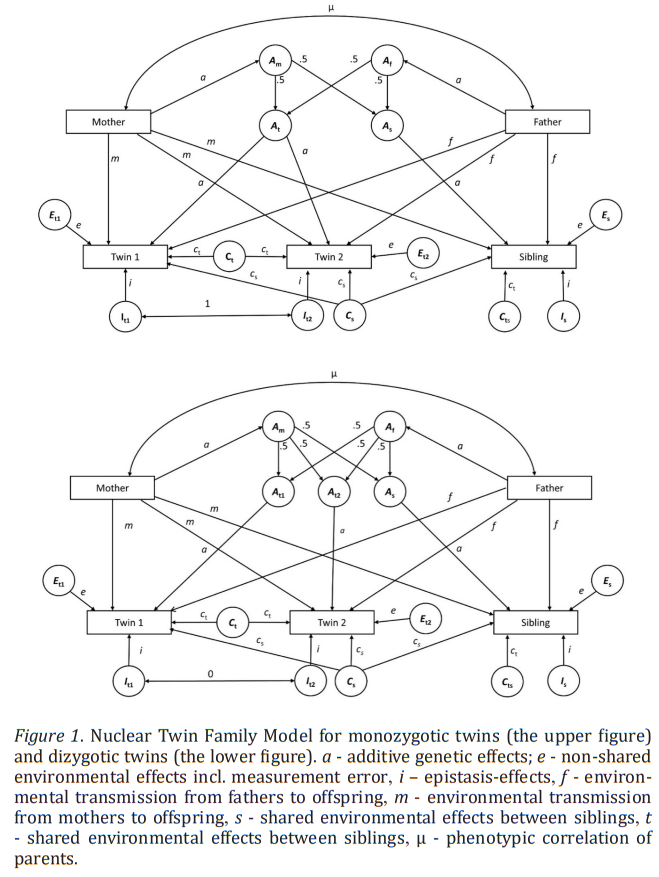
-
EEA: Parenting
Rowe (1983, Table 3) applied a biometric model to a sample comprising twins (59 MZ and 31 DZ, aged 14-18) and siblings (52 same-sex and 66 opposite-sex, aged 11-19). The twins reported their physical traits and “confusability” of appearance. Perceptions of family environment were ascertained with the 90-item FES which consists of 10 subscales. Their test-retest reliabilities range from .68 to .86. A varimax PCA was applied to these 10 subscales separately for twins and siblings, extracting 2 factor scores identified as acceptance-rejection (AR) and restrictiveness-permissiveness (RP). To test EEA, two reduced biometric models are compared against the full model: “a genetic model (G-E1), an environmental model (E2-E1), and a combined model involving all three parameters (G-E2-E1). The E2-E1 model starts with the assumption that similarity of siblings arises from purely environmental determinants (E2) and that uncorrelated environmental factors (E1) account for differences within sibling pairs. The G-E1 model, in contrast, replaces the environmental E2 parameter with a genetic parameter (G) and assumes that all family resemblance arises from genetic determinants.” (note: read the paper regarding the twin model assumption). Best model for AR factor was G-E1, rejecting EEA. Best model for RP factor was E2-E1, validating EEA. No sex interaction by perceived environment was found, since the same E1 variance that fitted the same-sex sibships also fitted for opposite-sex sibships.
Goodman & Stevenson (1991) in a commentary to Plomin & Bergeman (1991) showed that EEA is tenable, using a sample of 70 recognized MZ pairs, 25 unrecognized MZ pairs, and 111 same-sex DZ. They are urban twins, aged 13, drawn from inner London boroughs. Zygosity was established from biological markers or a questionnaire. There was very little difference in parental warmth or criticism mean scores between recognized and unrecognized MZ twins.
O’Connor et al. (1995) examine the Nonshared Environment and Adolescent Development (NEAD). Data included 92, 94, 90 pairs of MZ, DZ, full non-twin siblings from nondivorced families and 171, 104, 124 pairs of full, half, unrelated non-twin siblings. All families were visited in their homes and videotaped for 10 minutes regarding their parent-adolescent relationship. A team was employed to code their mutual behaviour. Exact agreement between a criterion coder and the other coders averaged 76% (range = 69-86%) across the 14 behavior codes, of which 12 related to parent positivity, negativity, control, and 2 were identified as adolescent prosocial and antisocial behavior. A twin-(unrelated)sibling design allows them to fit an ACDE model with a twin environment. Age and sex differences were adjusted prior to modeling. Models were fitted separately for the 14 behavior codes and for father/mother behavior to adolescents and for adolescent behavior to father/mother. Two findings are worth noting: 1) in all cases the ACE is retained because the ACDE fit equally well, 2) in all cases the model that estimates environmental parameters separately for twins versus nontwins or nondivorced versus stepfamilies did not fit better than the model that imposes group equality. The latter point supports EEA. The heritabilities were either small or close to zero in all cases whereas the non-shared environment (e²) was exceptionally high in all cases. But when they apply the common factor model recommended by McArdle & Goldsmith (1990), which removes the error variance from the e² variance, the heritabilities were large (modest) for adolescent (parent) behavior.
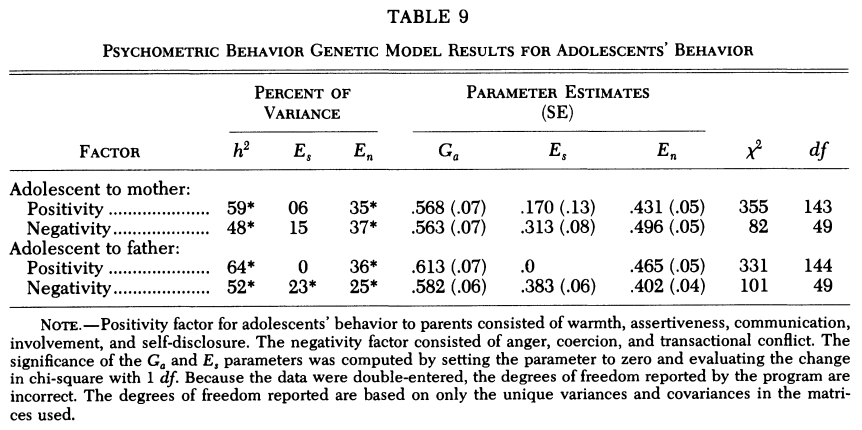
Jay Schulz-Heik et al. (2009) analyzed 271 MZ, 397 DZ pairs and 1143 full sibling pairs in the Add Health, Wave III. Three maltreatment (before entry into sixth grade) variables are used: neglect (2 items), sexual (1) and physical maltreatment (1). The ACTE univariate models were fitted for all variables. The twin effect was small in males but large in females for maltreatment variables (including their sum score), while the reverse was true for neglect. Heritabilities were small, sometimes close to zero. Here also, measurement error is likely a problem. In the multivariate model, correlations between these three outcomes for the A, C and T parameters were all close to zero.
Vinkhuyzen et al. (2010, Table 6) investigated family environments using the NTR, based on 560 twins and siblings (age =47.11 years). Each domain (Life Experience List, childhood environment, social environment and behavior, leisure time activities, life events) was measured using a variety of items. The ACTE/ADTE models were only fitted to life events data (which came with three outcomes: positive, neutral, negative) only because DZ and full sibling correlations differed significantly. The genetic models are separated by age (≤18 and ≥19). Only for the age group ≤18 and for negative and neutral events, there was a large t² effect, at .36 and .26 respectively. The twin environment was not included in the other models, suggesting that t² vanishes in adulthood. Heritabilities were moderate or high for neutral and positive life events in adulthood while heritability could be fixed to zero for negative life events.
-
EEA: Religious and Political views
Maes et al. (1999, Table 3) use a large extended twin family data (twins’ parents, siblings, spouses and children) from the Virginia 30,000 (formerly VTR). This allows complex models to be fitted, including parent transmission, sibling and twin environments, G-E correlation, assortment, etc. All participants completed 2 questions: 1) church attendance, 2) alcohol use. Models were fitted separately for each gender. For church attendance, broad h² was high for men (53%) and women (50%) with a very weak dominance, nonshared environment explained 47% for men and 40% for women, with the remaining variance showing very small effect of G-E covariance, cultural transmission and twin environment. For alcohol use, broad h² was modest for men (37%) and women (25%), e² explained 46% for men and 41% for women, with t² explaining 5% for men and 11% for women. Oddly, Truett et al. (1994) used the same data and method but found a large twin effect t² for church attendance, 13% and 14% for males and females.
Eaves & Hatemi (2008) use twin family data (N=29356, aged 18-84) from Virginia 30,000. The items related to abortion and gay rights were contained in a 28-item attitude inventory as part of ‘‘Health and Life Styles” inventory (test-retest r = .78-.86). The full model showed high heritability for abortion and gay rights in both sexes (.51-.69), moderate non-shared environment in both sexes (.21-.31), and non-trivial twin environment effect for abortion in females only (.11) and gay rights in males only (.09), while sibling shared environment is very small and cultural transmission and rGE non-existent.
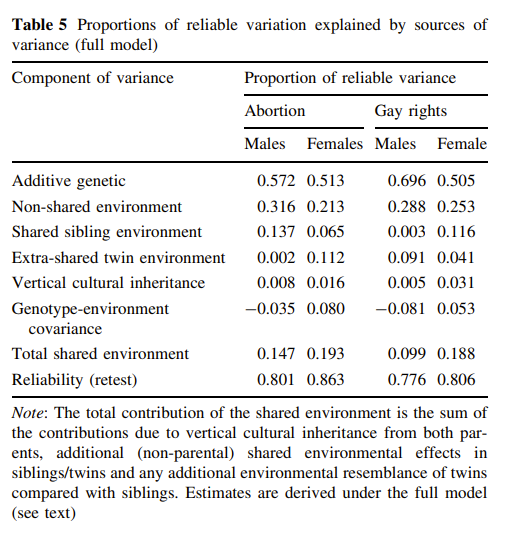
Hatemi et al. (2009) examine the longitudinal Mid Atlantic Twin Registry (MATR). The Wilson-Patterson Inventory, containing 50 items on political attitudes. Across the 11-20 years-old span, there was almost no difference between MZ and DZ correlations, and while the MZ correlations were quite stable between 17-75+ years old, the DZ correlations drop sharply after age 20. The lack of any rMZ-rDZ difference during childhood is surprising because MZs have more similar shared environments imposed upon them during this period. The authors observed: “If there were systematic unequal environmental influence provided by social influences in adolescence, DZ correlations should be much lower in adolescence and might even grow in adulthood, but this is not at all the case. One explanation for this pattern is that those pairs who are most discordant in attitudes are the first to leave the nest, and genetic differences are a large contributor for leaving home and each other (e.g., see Posner et al. 1996). An alternative explanation may be that DZ twin pairs are choosing less similar environments than MZ twin pairs for reasons which are not influenced by genes, thus influencing MZ twin pairs to be more like each other or become less dissimilar as compared with DZ twin pairs. However, this would run counter to previous analyses of social attitudes. In a longitudinal study Posner et al. (1996) found that attitude similarity was the basis for the amount of contact between twins and not vice versa in an Australian population.”
Hatemi et al. (2010, Table 3) examine the social/political attitude from the 28-item Wilson-Patterson Inventory, using a very large sample of twins and their nontwin full siblings and parents from the same MATR data. Much of these items were re-administered 2 years later, allowing them to be corrected for unreliability. This twin family design allows the model to estimate the effects specifically attributable to the DZ twin environment’s being more similar than a nontwin sibling environment, while modeling parental transmission, assortment etc. Only 2 items (male group analysis) and 4 items (female group analysis) show a modest twin-specific effect. All other items, plus the political factor, showed no twin-specific effect, validating EEA.
Smith et al. (2012, Table 5) use a sample of 596 same-sex twin pairs (356 MZs, 240 DZs) with complete data from the Minnesota Twin Family Registry. Similar experience and mutual influence scales are measured with 4 and 3 items. Twins were also given the 27-item Wilson-Patterson Index (α=.85). The DZ correlations vary greatly depending on environmental experiences whereas the MZ correlations do not vary at all. They apply an ACE model but use either similar experience or mutual influence as moderator (M) variable on ACE paths. Each moderated model specifies a different value of this moderator: low, mean, high. The heritability of political attitudes (h²=.60) between the unmoderated model is very similar to any of the six moderated models (minus one).
Littvay (2012) analyzed the Minnesota Twins Political Survey which contains the 27-item Wilson-Patterson Index. Twin environment was measured with 4 items (shared a bedroom, same friends, same classes, dressed alike) and averaged across the twin pairs to produce a sum score and also factor analyzed to produce a factor score. EEA was tested using the ACCE model, an extension to the ACE model which separates the C component into specified common environment (CS) and residual environment (CR). Based on the Chi-squared nested model test and using the environment factor score, only 3 political measures (out of 27) showed that the ACCE model fits better than the ACE model based on the p-value. The parameters are compared between ACE and ACCE models for the few questionnaires that select ACCE as the best model. The additive genetic component (A) sometimes declines, sometimes increases in the ACCE model. While 5.9% of the models indicate violation of EEA, the author noted that “Because neither the phenotypes nor the specific environments measured are entirely independent of each other, I concede that the results provide some extremely weak evidence that an EEA violation could be real and present.”
Bell et al. (2018) analyzed 394 twin pairs from the German data JeTSSA. The twins, their parents and spouses took the 21-item Wilson-Patterson (WP) inventory, and the twins’ peers provided ratings on the twins’ political views (α=.76 for self- and α=.76 for single peer and α=.83 for averaged peer reports). Such extended twin family design allows them to estimate environmental transmissions and effects shared by all and by twins only. In their full model for twins’ self-reports, estimates of additive heritability, twin and all-family environment, non-shared environment were 38%, 6%, 9%, 42% but for twins’ mean peer reports those estimates were 11%, 15%, 15%, 56%.
Kornadt et al. (2018, Table 4) analyzed a large sample of twins (cohort age 17 and 23) with their siblings and parents using TwinLife. The three outcomes are based on composite scores of political participation (3 items; α=.58), political interest (1 item), social participation (7 items). Their baseline model excludes either non-additive or sibling shared environment or both. The global picture is that additive effect a² ranges between .25-.48, epistasis i² is zero except for social participation at age 23 (.16), sibling c² was always fixed to zero, the t² estimate was zero except for social participation at age 17 (.18) and political participation at age 17 (.20). This means there is once again a strong tendency for the twin effect t² to decline over time.
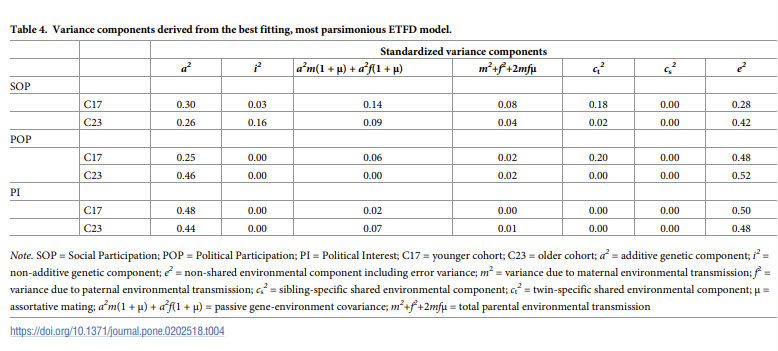
Hufer et al. (2020) use a twin family subsample of TwinLife, consisting of 4224 participants (cohort age 17 and 23). Political orientation was obtained with a single question, asking which party they feel closest to. Their design relied on a few nonlinear constraints, one of them is the adjustment for assortative mating. Model fitting suggested that removing non-additive genetic (d²) effect was preferable than removing sibling environment (s²) and that the parameters could not be equated across age groups. The estimates of h², rGE, c², s², t² and e² were .12, .17, .21, .16, .00, .33 at age 17 and .61, .00, .00, .14, .03, .21 at age 23. This confirms the vast literature indicating that prior to adulthood the heritability of political views is negligible.
-
EEA: Criminal behaviour
Dalgard & Kringlen (1976, Tables 11-12) use a twin register comprising all twins born in Norway between 1900-1935, totaling 138 pairs. Criminal history is obtained via semi-structured interview. The concordance for crime decreases with strong closeness among MZs but increases with strong closeness among DZs. The implication regarding EEA is unclear due to the small N pairs of DZs with strong closeness (N=5).
Kendler et al. (2007) use a sample in the VTR, comprising 469 MZ and 287 DZ pairs. Peer-group deviance was assessed by a sum score of 12 items from 2 validated instruments. These questions include: number of friends who smoked cigarettes, drank alcohol, got drunk, had problems with alcohol, skipped school a lot, cheated on school tests, stole anything or damaged property, had been in trouble with the law, smoked marijuana, used inhalants, used other drugs like cocaine, downers, or LSD (lysergic acid diethylamide), and sold/gave drugs to others. The ACE model produced large genetic effects: 38.8%, 50.7%, 54.9%, 53.5%, 50.5% at ages 8-11, 12-14, 15-18, 18-21, 22-25, respectively. However, when the socialization variable (i.e., degree of friend sharing in each age period) was added to the ACE model as specified environment, the shared environment C became insignificant and was dropped. In this resulting model, the genetic effects dropped substantially, but only at an early age: 13.8%, 31.6%, 43.0%, 46.6%, 46.2%.
van der Aa et al. (2009) examine the Netherlands Twin Registry (NTR), using a total of 4,835 twins (age ~19.78) and non-twin siblings (age ~22.26). Frequency of truancy is obtained through a single question asking how often they skipped lessons during a whole day while in high school. Due to extreme skewness, the item was dichotomized (0=never, 1=one or more times). Twin-sibling data allows the models to compare the covariance of DZs and full siblings; a difference would imply a twin effect. All genetic models adjust for age effect. Their best model, the ATE, is one that estimates twin-specific environment (T) and constrains all parameters to be equal across sex groups. While EEA is strongly rejected, the heritability is still substantial (A=45%, T=25%, E=30%).
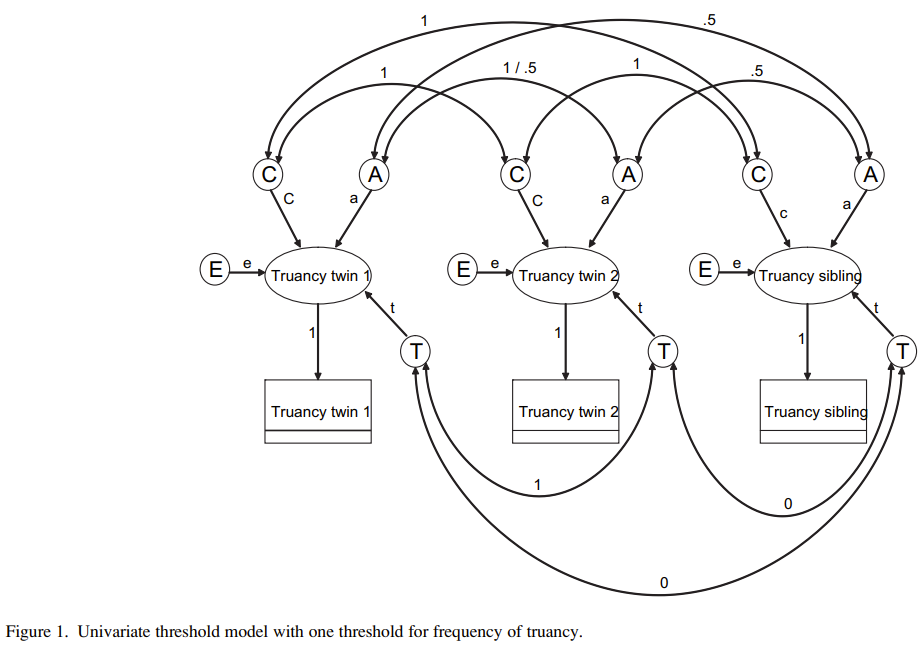
Kendler et al. (2015, Table 4) examine a very large sample of full and half siblings (reared apart and together) from the Swedish Multi-Generation Registry. Criminal conviction includes: violent crimes, white-collar crimes, property crimes. They use an ACCE model, where C is decomposed into two components, labeled CB for rearing environment and CS for specific shared environment that are indexed by age differences. The logic is that the sharing of social environments and peers decreases for siblings with increasing age differences between them. Their final ACCE model applied to all 3 samples yields heritability of 48% and 52% for females and males, close to the twin estimates.
-
EEA: Health and mental health
Heller et al. (1988, Table 6) gathered a group of 200 adult twin pairs from Newcastle, Sydney, New South Wales, and Australia. The three outcomes are: smoking status, frequency of alcohol consumption, engagement in vigorous exercise. For all outcomes, their concordance for either MZ or DZ twins was greater when the degree of contact frequency was higher, although their heritabilities were still close to 40%.
Neale et al. (1994) analyze 541 MZ and 388 DZ female pairs in the VTR. Lifetime prevalence of fears and phobias is assessed by the DIS III-A in wave 1. The twins were asked whether they have an unreasonable fear of blood, needles, hospitals, illness in wave 2 (each one of these items is used as outcome). They divided the MZ and DZ groups into 2 groups, above or below the entire sample median in treatment or contact variable (which are used for indexing the “specified environment”). This allowed them to extend the ACE into ACCE model, and applying it to this four-group data. For both fear and phobia diagnoses, similarity of treatment did not significantly increase twin concordance. The same result is found for frequency of contact.
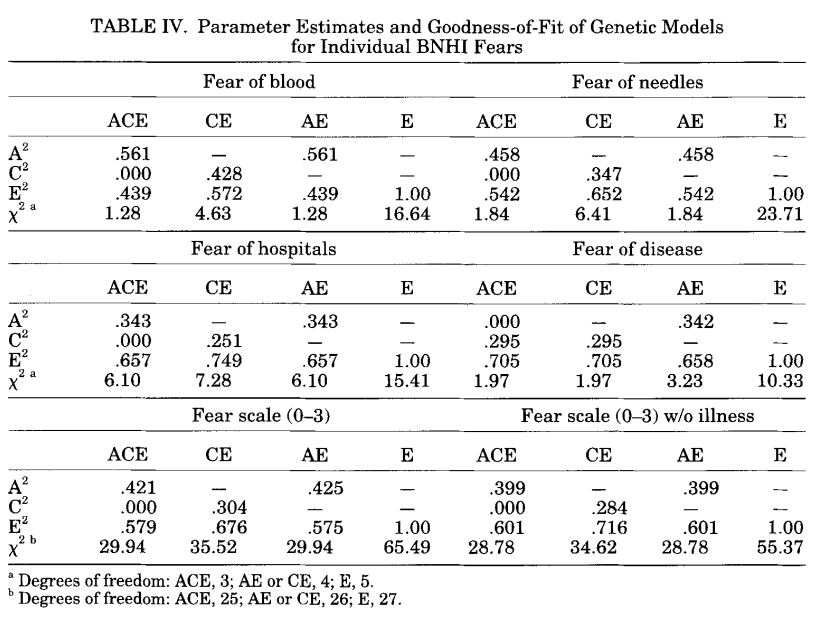
Maes et al. (1997, Table 5) studied BMI among 5921 twins from the VTR. Twins as well as their relatives (parents, siblings, spouses and children) were asked to give their height, weight. Prior to model fitting, the entire data was log transformed and corrected for the linear and quadratic effects of age, sex, twin status, source of ascertainment (Virginia vs. AARP), and their interaction terms. Their ACE model is extended by specifying rGE, dominance, assortative mating and twin specific environment, following Truett et al. (1994, Table 5) model for extended kinships of twins. Several parameters could be dropped (e.g., MZ environment, correlation between male and female dominance, shared environment, etc.) without deteriorating the model. In their best fitted model, the ADE, the special twin environment explains 7-8% and the broad heritability was as high as 65-66%. They also found modest correlations (r=.10 and r=.14) between the two measures of social contact and intrapair difference in BMI.
Svensson et al. (2003) use a subsample of 314 twin pairs reared apart and 364 matched control pairs reared together from the Swedish Twin Registry and aged 42-81. They were asked a single question: whether they ever had migraine, characterized by one-sided headache, nausea, and sensitivity to light. The median age at separation for the reared apart twins was 19. Logistic regression was used to test EEA: migraine in the co-twin, zygosity, and age at separation or degree of contact were used as predictors of migraine in the first twin. Zygosity and separation did not predict the outcome variable.
Kessler et al. (2004, Tables 1 & 4) use the MIDUS twin data, comprising 794 twin pairs and 610 sibling pairs. Outcomes include self-reported mental health (4 items) and the six Ryff-Keyes well-being scales (3-4 items per scale) and four scales of social responsibility. Their regression uses zygosity (coded 0 for DZ and 1 for MZ) and the within-pair scores on the 3 items of twin environment (similarity in playmates, school class, and dress) as predictors of within-pair differences on each outcome. Out of the 42 coefficients, 7% of these were significant and their sign pattern inconsistent. These standardized coefficients averaged .07. Their twin-sibling genetic model specifies all components to differ across genders and special twin environments that lead twins (whether MZ or DZ) to be more similar to each other than non-twins are. For self-rated mental health, the AE model showed best fit and no sex-specific or twin-environment effect. For other outcomes, AE and ADE were most often selected as best fit models. The twin environment was almost always constrained to zero, was generally small when estimated, and showed sex-related effects because a few outcomes showed modest effects of twin environment for men but close to zero for women. For all models that were fitted the E component is always unbelievably large, between 60-90%, potentially reflecting measurement error.
Nes et al. (2010) use 3310 twin pairs (aged 18-31) from the Norwegian twin panel (NIPHTP) and 54540 respondents in nuclear families from the HUNT. Outcome is subjective well-being based on cognitive aspect, positive and negative affect, using 4 items (α = .70 and .79), adjusted for age effects. They found two model specifications that fit equally well: 1) sex differences in A and D effects and absence of cultural transmission 2) sex differences in additive genetic and non-zero sibling, twin and MZ twin effects and absence of dominance and cultural transmission. In model 1, A and D account for 17% and 19% in males, and 27% and 7% in females, total environment for 64% in both sexes, while twin effects (T) account for 12.3% of this total environment. In model 2, A accounts for 18% in males and 25% in females, total environment for 82% and 75%, while twin effects (T) account for 8.4% of this total environment.
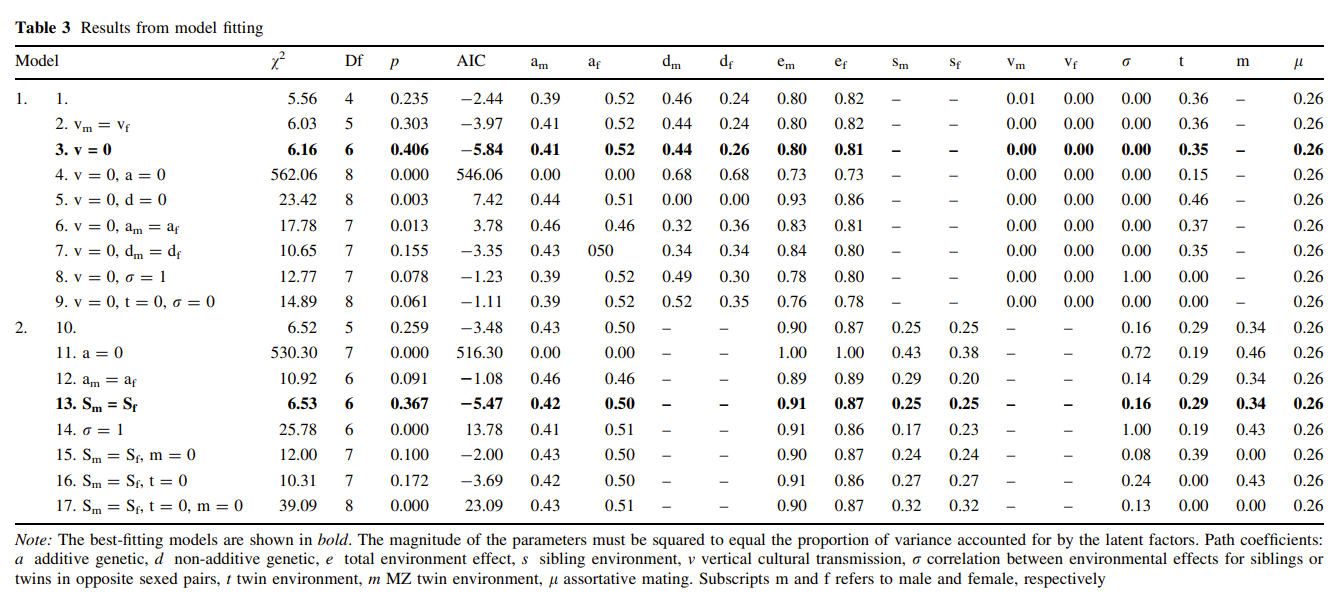
McCaffery et al. (2011) analyzed 1966 MZ and 1529 DZ male pairs in the VET. BMI was calculated as weight (kg)/height squared (m). Height and weight were obtained from military records in 1968 and by self-report in 1990. Social contact is the sum score of 2 items. A regression was conducted by using zygosity, social contact and their interaction as predictor of twin-pair differences in BMI changes over time: twins who reported greater contact were also more similar in their change in BMI. The ACE model was extended by adding the social contact as a specified environment parameter, resulting in the ACCE. In this model, social contact accounted for 16% of the variation in BMI.
Bergin et al. (2012) analyze BMI fluctuation using a large twin family sample from “Virginia 30,000”. Self-report BMI is calculated as current, highest, and lowest weight (kg)/height (m²). BMI fluctuation is the difference between highest and lowest BMI. They fit the typical extended twin family model, but included age regression on BMI fluctuation. Their most parsimonious model excludes sex-specific genes, male dominant genetic factors, sibling environment, assortative mating, and cultural transmission due to their CIs containing zero. They display the results for the full model only: heritability was modest for males (31% A, 0% D) and females (15% A, 29% D) and twin environment substantial for males (22%) and females (15%).
-
EEA: Nutrition
Fabsitz et al. (1978, Table 4) examine 232 MZ and 223 DZ male pairs aged 42-56 from the NHLI Twin Study. Contact frequency was measured with a single item. The food frequency questionnaire elicited 3 types of information: (1) frequency with which food items characteristic of the American diet were consumed in a day or over a period of 1 week, (2) accuracy of responses to the quantitative information described above, and (3) meal and snack habits as to time and frequency. Individual items were quantified by a computer program which, based on a “food composition” table, calculated intake values for calories, total fat, saturated and unsaturated fatty acids, total carbohydrates, and simple and complex carbohydrates. A comparison of MZs who seldom versus often get together shows that the intraclass correlations are generally larger for MZs who often get together. A similar pattern is found among DZ twins.
van den Bree et al. (1999) recruited 4640 twin pairs (aged ≥50) through advertisement in the Journal of the American Association of Retired Persons (AARP). Dietary measures come from the National Cancer Institute’s 99-item questionnaire. For each item, use of food or food group (yes/no), consumption frequency (times per day, week, month, year) and serving size (small, medium, large) were queried. Two “eating pattern” factor scores are extracted from a factor analysis of these 99 items. Twin similarity is assessed with 4 items at childhood and 2 items at adulthood, and each scale is summed and then dichotomized. They calculated correlations between childhood closeness and adult contact and intrapair differences for the 2 factor scores, for each question type (use, serving, frequency) and for the 5 twin groups separately. Only 2 of 60 correlations were significant.
Gunderson et al. (2006) examined 350 female twin pairs (aged 50) in the Kaiser Permanente Twin Registry. Dietary intake is measured with the 100-item Health Habits and History Questionnaire, representing 18 major food types. A factor analysis identified 2 factors: healthy and unhealthy dietary patterns. The intraclass correlations for MZs who correctly self-identified as MZs and MZs who self-identified as DZs were generally similar for healthy food factor, as well as for other outcomes such as BMI, waist circumference, fasting glucose, fasting insulin, LDL cholesterol, HDL cholesterol, triglycerides. Healthy and unhealthy food factors had heritabilities of 50% and 0% respectively.
-
EEA: Education
Eaves et al. (2011, Tables 4.15-4.17) use two large extended twin family data (twins, their parents, siblings, spouses and children) from the VTR and ATR. In both datasets, educational attainment is measured as years of schooling at lower levels, but these values are collapsed into fewer categories by the authors. At higher levels, it is recoded into broader categories such as high school, college, and postgraduate degrees. They fit a model allowing complex intergenerational transmissions along with assortment and twin effects. In their best fitted models, where D is dropped, educational attainment showed higher heritability in the US (59/58%) compared to Australia (34/41%) for males/females. The twin environment is not trivial for both the US (12/9%) and Australia (15/10%).
Conley et al. (2013, Tables 2-4) use the Add Health to test the EEA by comparing the degree of resemblance among same-sex twins whose genetic and self-reported zygosity match, to those whose identities do not align with their genetic zygosity (i.e., misclassification). Their sample includes 150 MZ pairs and 110+ same-sex DZ pairs. EEA is violated if heritability estimates and twin similarity (based on intraclass correlation) are lower based on genetic zygosity compared to perceived zygosity, due to accounting for environmental influences. For all traits studied, i.e., BMI, height, GPA, depression and ADHD, but except birth weight, heritability estimates based on perceived zygosity among all twins are lower than those based on genetic zygosity. DeFries-Fulker regression produces similar results. These results are replicated using the Swedish Twin Registry and Minnesota Twin Family Study where it was found that BMI, height, ADHD, GPA or years of education had all higher heritability for genetically-based zygosity, overall vindicating EEA. The results based on intraclass correlations among correct DZ, incorrect DZ, correct MZ and incorrect MZ twins, for the 3 datasets are inconclusive.
Felson (2014, Figures 1-2) uses the twin sample of the MIDUS study. There were 32 outcomes analyzed, comprising categories such as health, well-being, physical attributes, personality, self-efficacy, social and religious beliefs, social class; some outcomes are measured with a single item, some with multiple items. Environmental similarity is measured with 15 items, using 5 subscales and 1 total scale score based on all 15 items. To compare heritability estimates with and without controlling for environmental similarity, they apply a Defries-Fulker (DF) regression but adds the environmental similarity scale and its interaction with the twins’ trait. Furthermore, a simulation model was used to estimate the distribution of results one would obtain if environmental similarity did not confound heritability for any outcome.
Results showed that only one outcome (neuroticism) exhibited a significant reduction in heritability after controlling for environmental similarity, while simulation models and real data display heritability reductions averaging 7% and 14%, respectively. The author notes that “estimates of environmental confounding vary dramatically across outcomes that are similar, i.e between psychological well-being, depression and life satisfaction; and between education, income and net worth. The lack of discernible patterns here suggests that variation in apparent confounding across outcomes reflects chance fluctuation. Further evidence that differences in apparent confounding across outcomes is due to random processes comes from comparisons with results from wave two. Among the 26 outcomes that exist at both waves, heritability reduction between waves correlates at about 0.44, and when one outlier (life satisfaction) is removed, the correlation falls to 0.20.” Reliabilities of environmental scales range between .78 and .96. To gauge the effect of measurement error, errors-in-variables regressions are estimated for the absolute differences between co-twins in each of the 32 outcomes on a dummy variable for monozygotic twins with and without controlling for the 5 environmental scales. On average, adjusting for lower-bound reliability increases environmental confounding by 8%.
Felson (2014) also re-evaluated Loehlin and Nichols (1976) by using twins’ own reports of treatment similarity instead of parents’ reports since parents may be loathe to acknowledge differences in how they treat their children. Outcome variables include vocational interests, personality characteristics, quality of interpersonal interaction, and test scores in English, math, social studies, natural science and vocabulary. Environmental similarity is a composite score of 4 items. The correlation between the twin report of similarity and differences between co-twins on each of the 35 outcomes averaged 0.09. Here again, environmental confounding was not patterned across outcomes despite being larger than reported by Loehlin and Nichols due to using a more reliable measure of environmental similarity.
Eifler et al. (2019, Tables 3-4) analyzed 432 MZ and 529 DZ twin pairs (cohort age = 11 and 17) and 317 siblings from TwinLife Project. Grades such as math, German, and GPA were obtained from school reports, and adjusted for sex, age, and type of school. They fitted a four group (zygosity by age cohort) genetic model, and found the best model by dropping dominance, sibling environment, and group equality in the parameters. Heritability was high for all grade outcomes and age (.34-.62) but twin environment was not trivial (.00-.40). Interestingly, twin environment was much lower at age 17 than age 11. Heritabilities increased and twin environment decreased when twins are assigned to different classes instead of same class. A multivariate analysis could detect whether this twin environment is related with g, but it wasn’t attempted.
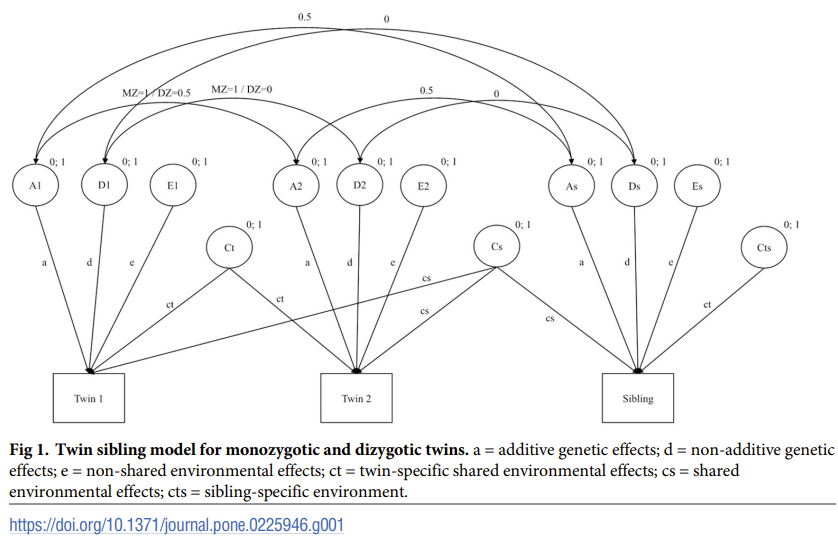
Eifler & Riemann (2022) use data on 23-years old twins and their siblings and parents from TwinLife. All family members were asked whether they had left school and about their school leaving certificates. The best, most parsimonious twin family model is one that excludes dominance and parent environmental transmission. In this model, heritability and twin environment account for 61.1% and 12.4%.
Mönkediek (2021, Table 8) analyzed the German data TwinLife, based on 622 MZ and 954 DZ twins, all were children of alcohol/drug dependent fathers. Outcomes studied are Maths grade, German grade and secondary school track attendance. EEA is tested in two different ways. First, with twins’ physical resemblance based on the average score of parents’ perceptions of twins’ hair colour, texture, eye colour, earlobes etc. Second, with mother’s self-reported parenting based on 10 items measuring 5 subscales. These 5 subscales, along with the 10-item sum score, are analyzed separately. In the first analysis, OLS regressions include physical resemblance, zygosity and their interaction term as predictors of Maths and German grade. None of the coefficients were significant among twins enrolled in specific school tracks (lower or upper secondary school) or twins enrolled in the same school type. In the second analysis, separate OLS regressions are conducted for each parenting scale and each outcome variable with predictors such as parenting scale, twin zygosity and their interaction term. None of the subscales or the total sum score showed either a direct or interaction effect for differences in parenting, except for psychological control.
Starr & Riemann (2022) use a large sample of twins (aged 11 and 17) and their siblings from TwinLife. School grades in math and German were obtained from school reports. Cognitive ability is measured using 4 subscales of the Culture Fair Test (ω = .75/.80 at age 11/17). Conscientiousness is measured using the Big Five inventory (ω = .62/.69 at age 11/17). Self-perceived abilities (SPA) for math and German are assessed using Scales on the Academic Self-Concept (ω = .88/.93 for math; ω = .84/.88 for German). Univariate models dropped either the non-additivity or sibling shared environment depending on rDZ – ½rMZ but specified a twin environment: this t² effect could be constrained to zero for most outcomes and groups, and was large when estimated for grade, but declined drastically at age 17. The multivariate models do not include t² since its poor relevance in univariate models implies that t² would not explain the relation between the four measured traits.
Bingley et al. (2023, Tables 3-4 & 7) use a large sample of twins, their spouses, and children from the Danish Twins Registry. Institutions report the educational qualifications to the Ministry of Education, and Statistics Denmark calculates the highest level of education. They extended the CTD framework by testing its assumptions one by one, e.g., assortative mating (AM), dominance, G×E, by adding parameters and some constraints (to identify the model). AM downwardly biased heritability (34% versus 41%), but neither dominance nor G×E had an impact on heritability. The last specification extends the CTD by relaxing EEA, which is done by allowing the degree of environmental sharing to differ based on zygosity and gender composition in an avuncular relationship and by adding some constraints to accommodate the twin family design. The estimates of h² and c² are 9% and 50% for their twin family design compared to 34% and 24% for the CTD framework. When this model is applied to other outcome variables, the same pattern is observed. For instance, the h² decreases from 60% to 17% for earnings, from 54% to 13% for disposable income, and from 42% to 14% for assets. The results for education are still puzzling. That AM no longer affects their decompositions could be due to AM losing its explanatory power now that the model is better able to differentiate between genetic and environmental influences, but it doesn’t explain why many other studies found that heritability increases after accounting simultaneously for AM and twin environment. This discrepancy is likely methodological. The typical twin family model estimates the amount of differential environmental sharing in twin-sibling relationships but not in avuncular relationships as was the case in Bingley et al. (2023).
Wolfram & Morris (2023) use twin family data from TwinLife. Both twins and siblings are adults. The self-reported education qualification is transformed into their corresponding years of education, and used as such. The phenotypic assortment model and social homogamy model are compared against a saturated model by dropping unneeded parameters in each model. The phenotypic assortment fitted best, producing additive effect of 51%, sibling environment of 10%, twin environment of 16%, non-shared environment of 23%. The typical CTD framework yielded 34%, 43%, 23% for the ACE parameters. The authors rightly pointed out that the C component in the CTD cannot be interpreted as between-family influences as long as it includes a twin environment. Partitioning C into non-twin sibling (CS) and twin (CT) environments logically reduces the between-family environment.
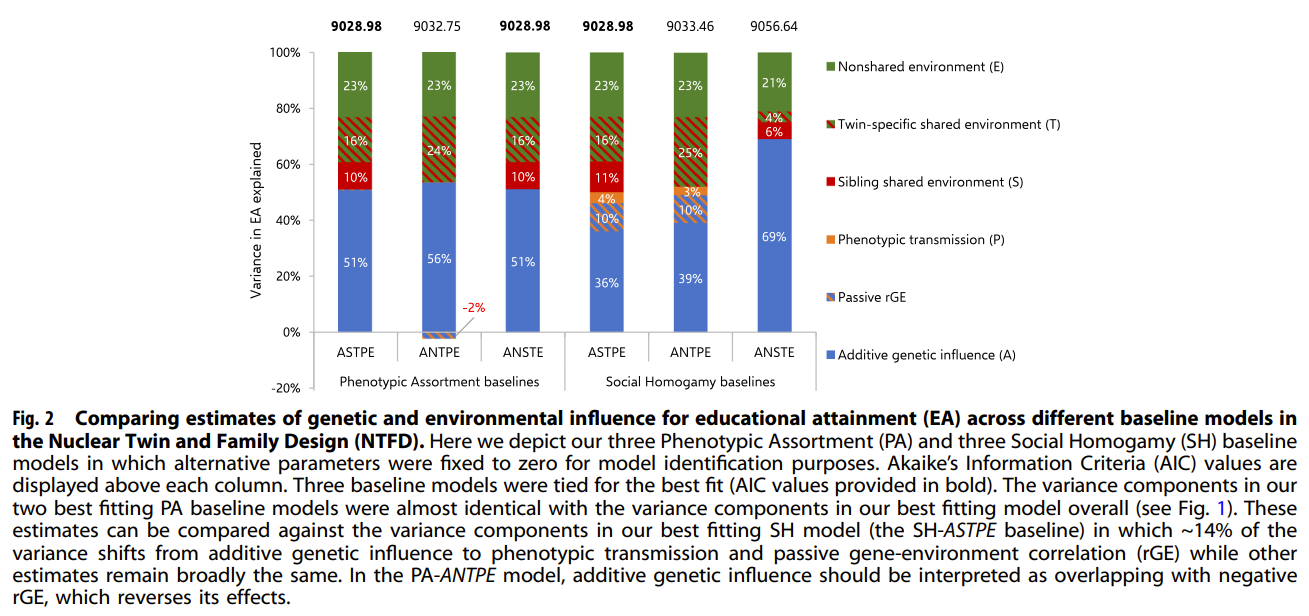
-
Research on unrelated look-alike pairs
If twins are treated more similarly because they are perceived as being more physically similar, another way to indirectly test EEA is to compare unrelated look-alike people (U-LA). Segal (2013) and Segal et al. (2013) examine 24 male and 24 female U-LAs (age = 46.21) in Canada, originally identified by a Canadian photographer. Most pair members did not have personal contact with one another (56.5%) or met only one time per year, on average, or less (17.4%). They were given the 200-item Personality for Professionals Inventory (PfPI), the 10-item Rosenberg Self-Esteem Scale, as well as the 60-item NEO, which measures the Big Five personality. Feelings of initial and current social closeness was measured with the Social Relationship Inventory. The U-LA intraclass correlations (ICCs) for these five personality traits range between -.29 to .18 (mean =-.03), the U-LA ICCs for the 21 scales of the PfPI varied between modest and very small with negative and positive signs, the U-LA ICC for self-esteem was -.03 which contrasts with the positive ICC found among MZ and DZ twins. This is consistent with Rowe’s (1994, pp. 45-48) review on studies about physical appearance having little to no effect on similarity in the twins’ psychological traits. Similar treatment cannot make people alike in psychological traits if that treatment does not causally affect biological functions underlying broad traits.
References
- Andrew, T., Hart, D. J., Snieder, H., de Lange, M., Spector, T. D., & MacGregor, A. J. (2001). Are Twins and Singletons Comparable? A Study of Disease-related and Lifestyle Characteristics in Adult Women. Twin Research, 4(6), 464–477.
- Bailey, J. M., Dunne, M. P., & Martin, N. G. (2000). Genetic and environmental influences on sexual orientation and its correlates in an Australian twin sample. Journal of Personality and Social Psychology, 78(3), 524–536.
- Bares, C. B., Maes, H. H., & Kendler, K. S. (2017). Familial and special twin influences on cigarette use initiation. Twin Research and Human Genetics, 20(2), 137–146.
- Barnes, J. C., Wright, J. P., Boutwell, B. B., Schwartz, J. A., Connolly, E. J., Nedelec, J. L., & Beaver, K. M. (2014). Demonstrating the validity of twin research in criminology. Criminology, 52(4), 588–626.
- Bell, E., Kandler, C., & Riemann, R. (2018). Genetic and environmental influences on sociopolitical attitudes. Politics and the Life Sciences, 37(02), 236–249.
- Bergin, J. E., Neale, M. C., Eaves, L. J., Martin, N. G., Heath, A. C., & Maes, H. H. (2012). Genetic and Environmental Transmission of Body Mass Index Fluctuation. Behavior Genetics, 42(6), 867–874.
- Bingley, P., Cappellari, L., & Tatsiramos, K. (2023). On the Origins of Socio-Economic Inequalities: Evidence from Twin Families.
- Bishop, E. G., Cherny, S. S., Corley, R., Plomin, R., DeFries, J. C., & Hewitt, J. K. (2003). Development genetic analysis of general cognitive ability from 1 to 12 years in a sample of adoptees, biological siblings, and twins. Intelligence, 31(1), 31–49.
- Blanco, C., Myers, J., & Kendler, K. S. (2012). Gambling, disordered gambling and their association with major depression and substance use: a web-based cohort and twin-sibling study. Psychological Medicine, 42(3), 497–508.
- Bleidorn, W., Hufer, A., Kandler, C., Hopwood, C. J., & Riemann, R. (2018). A nuclear twin family study of self–esteem. European Journal of Personality, 32(3), 221–232.
- Borkenau, P., Riemann, R., Angleitner, A., & Spinath, F. M. (2002). Similarity of childhood experiences and personality resemblance in monozygotic and dizygotic twins: A test of the equal environments assumption. Personality and Individual Differences, 33(2), 261–269.
- Bouchard Jr, T. J. (2023). The Garden of Forking Paths; An Evaluation of Joseph’s ‘A Reevaluation of the 1990 “Minnesota Study of Twins Reared Apart” IQ Study’. Twin Research and Human Genetics, 26(2), 133–142.
- Braungart, J. M., Plomin, R., DeFries, J. C., & Fulker, D. W. (1992). Genetic influence on tester-rated infant temperament as assessed by Bayley’s Infant Behavior Record: Nonadoptive and adoptive siblings and twins. Developmental Psychology, 28(1), 40–47.
- Bulik, C. M., Sullivan, P. F., & Kendler, K. S. (1998). Heritability of binge-eating and broadly defined bulimia nervosa. Biological Psychiatry, 44(12), 1210–1218.
- Carmelli, D., Swan, G. E., Kelly-Hayes, M., Wolf, P. A., Reed, T., & Miller, B. (2000). Longitudinal changes in the contribution of genetic and environmental influences to symptoms of depression in older male twins. Psychology and Aging, 15(3), 505–510.
- Christensen, K., Petersen, I., Skytthe, A., Herskind, A. M., McGue, M., & Bingley, P. (2006). Comparison of academic performance of twins and singletons in adolescence: follow-up study. Bmj, 333(7578), 1095.
- Clifford, C. A., Hopper, J. L., Fulker, D. W., & Murray, R. M. (1984). A genetic and environmental analysis of a twin family study of alcohol use, anxiety, and depression. Genetic Epidemiology, 1(1), 63–79.
- Cohen, D. J., Dibble, E., & Grawe, J. M. (1977). Fathers’ and mothers’ perceptions of children’s personality. Archives of General Psychiatry, 34(4), 480–487.
- Conley, D., Rauscher, E., Dawes, C., Magnusson, P. K., & Siegal, M. L. (2013). Heritability and the equal environments assumption: evidence from multiple samples of misclassified twins. Behavior Genetics, 43, 415–426.
- Cronk, N. J., Slutske, W. S., Madden, P. A., Bucholz, K. K., Reich, W., & Heath, A. C. (2002). Emotional and behavioral problems among female twins: An evaluation of the equal environments assumption. Journal of the American Academy of Child & Adolescent Psychiatry, 41(7), 829–837.
- Dalgard, O. S., & Kringlen, E. (1976). A Norwegian twin study of criminality. The British Journal of Criminology, 16(3), 213–232.
- de Zeeuw, E. L., & Boomsma, D. I. (2017). Country-by-genotype-by-environment interaction in childhood academic achievement. Proceedings of the National Academy of Sciences, 114(51), 13318–13320.
- Derks, E. M., Dolan, C. V., & Boomsma, D. I. (2006). A test of the equal environment assumption (EEA) in multivariate twin studies. Twin Research and Human Genetics, 9(3), 403–411.
- Dolan, C. V., Huijskens, R. C., Minică, C. C., Neale, M. C., & Boomsma, D. I. (2021). Incorporating polygenic risk scores in the ACE twin model to estimate A–C covariance. Behavior Genetics, 51(3), 237–249.
- Dong, L., Giangrande, E. J., Womack, S. R., Yoo, K., Beam, C. R., Jacobson, K. C., & Turkheimer, E. (2023). A Longitudinal Analysis of Gene x Environment Interaction on Verbal Intelligence Across Adolescence and Early Adulthood. Behavior Genetics, 53(4), 311–330.
- Duncan, L. E., & Keller, M. C. (2011). A critical review of the first 10 years of candidate gene-by-environment interaction research in psychiatry. American Journal of Psychiatry, 168(10), 1041–1049.
- Eaves, L. J., Foley, D., & Silberg, J. (2003). Has the “Equal Environments” Assumption Been Tested in Twin Studies? Twin Research, 6(6), 486–489.
- Eaves, L. J., & Hatemi, P. K. (2008). Transmission of attitudes toward abortion and gay rights: Effects of genes, social learning and mate selection. Behavior Genetics, 38, 247–256.
- Eaves, L. J., Hatemi, P. K., Heath, A. C., & Martin, N. G. (2011). Modeling the cultural and biological inheritance of social and political behavior in twins and nuclear families. In Hatemi, P. K., & McDermott, R. (Eds.), Man is by nature a political animal: Evolution, biology, and politics (pp. 101–184). Chicago and London: University of Chicago Press.
- Eaves, L. J., Last, K. A., Martin, N. G., & Jinks, J. L. (1977). A progressive approach to non‐additivity and genotype‐environmental covariance in the analysis of human differences. British Journal of Mathematical and Statistical Psychology, 30(1), 1–42.
- Eaves, L. J., Last, K. A., Young, P. A., & Martin, N. G. (1978). Model-fitting approaches to the analysis of human behaviour. Heredity, 41(3), 249–320.
- Ehringer, M. A., Rhee, S. H., Young, S., Corley, R., & Hewitt, J. K. (2006). Genetic and environmental contributions to common psychopathologies of childhood and adolescence: a study of twins and their siblings. Journal of Abnormal Child Psychology, 34, 1–17.
- Eifler, E. F., & Riemann, R. (2022). The aetiology of educational attainment: A nuclear twin family study into the genetic and environmental influences on school leaving certificates. British Journal of Educational Psychology, 92(3), 881–897.
- Eifler, E. F., Starr, A., & Riemann, R. (2019). The genetic and environmental effects on school grades in late childhood and adolescence. PLoS ONE, 14(12), e0225946.
- Eisen, S., A., Lin, N., Lyons, M. J., Scherrer, J. F., Griffith, K., True, W. R., Goldberg, J., & Tsuang, M. T. (1998). Familial influences on gambling behavior: an analysis of 3359 twin pairs. Addiction, 93(9), 1375–1384.
- Eriksson, M., Rasmussen, F., & Tynelius, P. (2006). Genetic factors in physical activity and the equal environment assumption–the Swedish young male twins study. Behavior Genetics, 36, 238–247.
- Fabsitz, R. R., Garrison, R. J., Feinleib, M., & Hjortland, M. (1978). A twin analysis of dietary intake: Evidence for a need to control for possible environmental differences in MZ and DZ twins. Behavior Genetics, 8(1), 15–25.
- Felson, J. (2014). What can we learn from twin studies? A comprehensive evaluation of the equal environments assumption. Social Science Research, 43, 184–199.
- Ghirardi, G., Gil-Hernández, C. J., Bernardi, F., van Bergen, E., & Demange, P. (2024). Interaction of family SES with children’s genetic propensity for cognitive and noncognitive skills: No evidence of the Scarr-Rowe hypothesis for educational outcomes. Research in Social Stratification and Mobility, 92, 100960.
- Goldsmith, H. H., Lemery, K. S., Buss, K. A., & Campos, J. J. (1999). Genetic analyses of focal aspects of infant temperament. Developmental Psychology, 35(4), 972–985.
- Goodman, R., & Stevenson, J. (1991). Parental criticism and warmth toward unrecognized monozygotic twins. Behavioral and Brain Sciences, 14(3), 394–395.
- Gottschling, J., Hahn, E., Beam, C. R., Spinath, F. M., Carroll, S., & Turkheimer, E. (2019). Socioeconomic status amplifies genetic effects in middle childhood in a large German twin sample. Intelligence, 72, 20–27.
- Grigorenko, E. L., & Carter, A. S. (1996). Co-Twin, Peer, and Mother-Child Relationships and I.Q. in a Russian Adolescent Twin Sample. Journal of Russian & East European Psychology, 34(6), 59–87.
- Gunderson, E. P., Tsai, A.-L., Selby, J. V., Caan, B., Mayer-Davis, E. J., & Risch, N. (2006). Twins of Mistaken Zygosity (TOMZ): Evidence for Genetic Contributions to Dietary Patterns and Physiologic Traits. Twin Research and Human Genetics, 9(4), 540–549.
- Hahn, E., Johnson, W., & Spinath, F. M. (2013). Beyond the heritability of life satisfaction – The roles of personality and twin-specific influences. Journal of Research in Personality, 47(6), 757–767.
- Hamilton, A. S., Lessov-Schlaggar, C. N., Cockburn, M. G., Unger, J. B., Cozen, W., & Mack, T. M. (2006). Gender differences in determinants of smoking initiation and persistence in California twins. Cancer Epidemiology Biomarkers & Prevention, 15(6), 1189–1197.
- Hatemi, P. K., Funk, C. L., Medland, S. E., Maes, H. H., Silberg, J. L., Martin, N. G., & Eaves, L. J. (2009). Genetic and Environmental Transmission of Political Attitudes Over a Life Time. The Journal of Politics, 71(3), 1141–1156.
- Hatemi, P. K., Hibbing, J. R., Medland, S. E., Keller, M. C., Alford, J. R., Smith, K. B., Martin, N. G., & Eaves, L. J. (2010). Not by twins alone: Using the extended family design to investigate genetic influence on political beliefs. American Journal of Political Science, 54(3), 798–814.
- Heath, A. C., Bucholz, K. K., Madden, P. A. F., Dinwiddie, S. H., Slutske, W. S., Bierut, L. J., Statham, D. J., Dunne, M. P., Whitfield, J. B., & Martin, N. G. (1997). Genetic and environmental contributions to alcohol dependence risk in a national twin sample: consistency of findings in women and men. Psychological Medicine, 27(6), 1381–1396.
- Heath, A. C., Jardine, R., & Martin, N. G. (1989a). Interactive effects of genotype and social environment on alcohol consumption in female twins. Journal of Studies on Alcohol, 50(1), 38–48.
- Heath, A. C., Neale, M. C., Hewitt, J. K., Eaves, L. J., & Fulker, D. W. (1989b). Testing structural equation models for twin data using LISREL. Behavior Genetics, 19(1), 9–35.
- Heller, R. F., O’Connell, D. L., Roberts, D. C. K., Allen, J. R., Knapp, J. C., Steele, P. L., & Silove, D. (1988). Lifestyle factors in monozygotic and dizygotic twins. Genetic Epidemiology, 5(5), 311–321.
- Herle, M., Fildes, A., van Jaarsveld, C., Rijsdijk, F., & Llewellyn, C. H. (2016). Parental reports of infant and child eating behaviors are not affected by their beliefs about their twins’ zygosity. Behavior Genetics, 46, 763–771.
- Hettema, J. M., Neale, M. C., & Kendler, K. S. (1995). Physical similarity and the equal-environment assumption in twin studies of psychiatric disorders. Behavior Genetics, 25, 327–335.
- Horwitz, A. V., Videon, T. M., Schmitz, M. F., & Davis, D. (2003). Rethinking Twins and Environments: Possible Social Sources for Assumed Genetic Influences in Twin Research. Journal of Health and Social Behavior, 44(2), 111–129.
- Hufer, A., Kornadt, A. E., Kandler, C., & Riemann, R. (2020). Genetic and environmental variation in political orientation in adolescence and early adulthood: A Nuclear Twin Family analysis. Journal of Personality and Social Psychology, 118(4), 762–776.
- Hunt, C. B., & Rowe, D. C. (2003). Genetic and shared environmental influences on adolescents’ timing of first sexual intercourse: The moderating effect of time spent with a sibling. In Rodgers, J. L., & Kohler, H-P. (Eds.), The biodemography of human reproduction and fertility (pp. 161–185). Boston, MA: Kluwer.
- Hur, Y.-M., & Bates, T. (2019). Genetic and Environmental Influences on Cognitive Abilities in Extreme Poverty. Twin Research and Human Genetics, 22(5), 297–301.
- Jacobson, K. C., Prescott, C. A., & Kendler, K. S. (2002). Sex differences in the genetic and environmental influences on the development of antisocial behavior. Development and Psychopathology, 14(2), 395–416.
- Jay Schulz-Heik, R., Rhee, S. H., Silvern, L., Lessem, J. M., Haberstick, B. C., Hopfer, C., & Hewitt, J. K. (2009). Investigation of genetically mediated child effects on maltreatment. Behavior Genetics, 39, 265–276.
- Johnson, W., Krueger, R. F., Bouchard, T. J., & McGue, M. (2002). The Personalities of Twins: Just Ordinary Folks. Twin Research, 5(02), 125–131.
- Jonnal, A. H., Gardner, C. O., Prescott, C. A., & Kendler, K. S. (2000). Obsessive and compulsive symptoms in a general population sample of female twins. American journal of medical genetics, 96(6), 791–796.
- Kaprio, J., Koskenvuo, M., Langinvainio, H., Romanov, K., Sarna, S., & Rose, R. J. (1987). Genetic influences on use and abuse of alcohol: a study of 5638 adult Finnish twin brothers. Alcoholism: Clinical and Experimental Research, 11(4), 349–356.
- Kaprio, J., Koskenvuo, M., & Rose, R. J. (1990). Change in cohabitation and intrapair similarity of monozygotic (MZ) cotwins for alcohol use, extraversion, and neuroticism. Behavior Genetics, 20(2), 265–276.
- Keller, M. C. (2014). Gene × environment interaction studies have not properly controlled for potential confounders: the problem and the (simple) solution. Biological psychiatry, 75(1), 18–24.
- Keller, M. C., Coventry, W. L., Heath, A. C., & Martin, N. G. (2005). Widespread Evidence for Non-Additive Genetic Variation in Cloninger’s and Eysenck’s Personality Dimensions using a Twin Plus Sibling Design. Behavior Genetics, 35(6), 707–721.
- Keller, M. C., Medland, S. E., Duncan, L. E., Hatemi, P. K., Neale, M. C., Maes, H. H. M., & Eaves, L. J. (2009). Modeling Extended Twin Family Data I: Description of the Cascade Model. Twin Research and Human Genetics, 12(01), 8–18.
- Keller, M. C., Medland, S. E., & Duncan, L. E. (2010). Are extended twin family designs worth the trouble? A comparison of the bias, precision, and accuracy of parameters estimated in four twin family models. Behavior genetics, 40, 377–393.
- Kendler, K. S., & Gardner, C. O. (1998). Twin studies of adult psychiatric and substance dependence disorders: are they biased by differences in the environmental experiences of monozygotic and dizygotic twins in childhood and adolescence?. Psychological Medicine, 28(3), 625–633.
- Kendler, K. S., Gatz, M., Gardner, C. O., & Pedersen, N. L. (2006). A Swedish national twin study of lifetime major depression. American Journal of Psychiatry, 163(1), 109–114.
- Kendler, K. S., Jacobson, K. C., Gardner, C. O., Gillespie, N., Aggen, S. A., & Prescott, C. A. (2007). Creating a Social World. Archives of General Psychiatry, 64(8), 958–965.
- Kendler, K. S., Karkowski, L. M., Neale, M. C., & Prescott, C. A. (2000a). Illicit psychoactive substance use, heavy use, abuse, and dependence in a US population-based sample of male twins. Archives of general psychiatry, 57(3), 261–269.
- Kendler, K. S., Maes, H. H., Sundquist, K., Ohlsson, H., & Sundquist, J. (2014). Genetic and family and community environmental effects on drug abuse in adolescence: a Swedish national twin and sibling study. American Journal of Psychiatry, 171(2), 209–217.
- Kendler, K. S., Neale, M. C., Kessler, R. C., Heath, A. C., & Eaves, L. J. (1993). A test of the equal-environment assumption in twin studies of psychiatric illness. Behavior Genetics, 23, 21–27.
- Kendler, K. S., Neale, M. C., Kessler, R. C., Heath, A. C., & Eaves, L. J. (1994). Parental treatment and the equal environment assumption in twin studies of psychiatric illness. Psychological medicine, 24(3), 579–590.
- Kendler, K. S., Lönn, S. L., Maes, H. H., Sundquist, J., & Sundquist, K. (2015). The etiologic role of genetic and environmental factors in criminal behavior as determined from full-and half-sibling pairs: an evaluation of the validity of the twin method. Psychological Medicine, 45(9), 1873–1880.
- Kendler, K. S., PirouziFard, M., Lönn, S., Edwards, A. C., Maes, H. H., Lichtenstein, P., Sundquist, J., & Sundquist, K. (2016). A national Swedish twin-sibling study of alcohol use disorders. Twin Research and Human Genetics, 19(5), 430–437.
- Kendler, K. S., Prescott, C. A., Neale, M. C., & Pedersen, N. L. (1997). Temperance Board Registration for Alcohol Abuse in a National Sample of Swedish Male Twins, Born 1902 to 1949. Archives of General Psychiatry, 54(2), 178–184.
- Kendler, K. S., Ohlsson, H., Lichtenstein, P., Sundquist, J., & Sundquist, K. (2019). The nature of the shared environment. Behavior Genetics, 49, 1-10.
- Kendler, K. S., Thornton, L. M., Gilman, S. E., & Kessler, R. C. (2000b). Sexual Orientation in a U.S. National Sample of Twin and Nontwin Sibling Pairs. American Journal of Psychiatry, 157(11), 1843–1846.
- Kessler, R. C, Gilman, S. E., Thornton, L. M., & Kendler, K. S. (2004). Health, well-being, and social responsibility in the MIDUS twin and sibling subsamples. In Brim, O. G., Ryff, C. D., & Kessler, R. C., (Eds.), How Healthy Are We?: A National Study of Well-Being at Midlife. (pp. 124–152). Chicago, IL: University of Chicago Press.
- Kieseppä, T., Partonen, T., Haukka, J., Kaprio, J., & Lönnqvist, J. (2004). High Concordance of Bipolar I Disorder in a Nationwide Sample of Twins. American Journal of Psychiatry, 161(10), 1814–1821.
- Klassen, L., Eifler, E. F., Hufer, A., & Riemann, R. (2018). Why do people differ in their achievement motivation? A nuclear twin family study. Primenjena psihologija, 11(4), 433–450.
- Klump, K. L., Holly, A., Iacono, W. G., McGue, M., & Willson, L. E. (2000). Physical similarity and twin resemblance for eating attitudes and behaviors: a test of the equal environments assumption. Behavior Genetics, 30, 51–58.
- Koenig, L. B., Jacob, T., Haber, J. R., & Xian, H. (2010). Testing the equal environments assumption in the children of twins design. Behavior Genetics, 40, 533–541.
- Koeppen-Schomerus, G., Spinath, F. M., & Plomin, R. (2003). Twins and Non-twin Siblings: Different Estimates of Shared Environmental Influence in Early Childhood. Twin Research, 6(2), 97–105.
- Kornadt, A. E., Hufer, A., Kandler, C., & Riemann, R. (2018). On the genetic and environmental sources of social and political participation in adolescence and early adulthood. PLoS ONE, 13(8), e0202518.
- LaBuda, M. C., Svikis, D. S., & Pickens, R. W. (1997). Twin closeness and co-twin risk for substance use disorders: assessing the impact of the equal environment assumption. Psychiatry Research, 70(3), 155–164.
- Lake, R. I. E., Eaves, L. J., Maes, H. H. M., Heath, A. C., & Martin, N. G. (2000). Further evidence against the environmental transmission of individual differences in neuroticism from a collaborative study of 45,850 twins and relatives on two continents. Behavior Genetics, 30(3), 223–233.
- Lessov, C. N., Martin, N. G., Statham, D. J., Todorov, A. A., Slutske, W. S., Bucholz, K. K., Heath, A. C., & Madden, P. A. (2004). Defining nicotine dependence for genetic research: evidence from Australian twins. Psychological medicine, 34(5), 865–879.
- Littvay, L. (2012). Do heritability estimates of political phenotypes suffer from an equal environment assumption violation? Evidence from an empirical study. Twin Research and Human Genetics, 15(1), 6–14.
- LoParo, D., & Waldman, I. (2014). Twins’ rearing environment similarity and childhood externalizing disorders: A test of the equal environments assumption. Behavior Genetics, 44(6), 606–613.
- Maes, H. H., Morley, K., Neale, M. C., Kendler, K. S., Heath, A. C., Eaves, L. J., & Martin, N. G. (2018). Cross-Cultural Comparison of Genetic and Cultural Transmission of Smoking Initiation Using an Extended Twin Kinship Model. Twin Research and Human Genetics, 21(3), 179–190.
- Maes, H. H., Neale, M. C., & Eaves, L. J. (1997). Genetic and environmental factors in relative body weight and human adiposity. Behavior Genetics, 27, 325–351.
- Maes, H. H., Neale, M. C., Martin, N. G., Heath, A. C., & Eaves, L. J. (1999). Religious attendance and frequency of alcohol use: same genes or same environments: a bivariate extended twin kinship model. Twin Research, 2(02), 169–179.
- Matheny Jr, A. P. (1979). Appraisal of Parental Bias in Twin Studies. Ascribed Zygosity and IQ Differences in Twins. Acta Geneticae Medicae et Gemellologiae: Twin Research, 28(2), 155–160.
- Matheny Jr, A. P., Wilson, R. S., & Dolan, A. B. (1976). Relations between twins’ similarity of appearance and behavioral similarity: Testing an assumption. Behavior Genetics, 6(3), 343–351.
- Matteson, L. K., McGue, M., & Iacono, W. G. (2013). Shared Environmental Influences on Personality: A Combined Twin and Adoption Approach. Behavior Genetics, 43(6), 491–504.
- Mazzeo, S. E., Mitchell, K. S., Bulik, C. M., Aggen, S. H., Kendler, K. S., & Neale, M. C. (2010). A twin study of specific bulimia nervosa symptoms. Psychological medicine, 40(7), 1203–1213.
- McArdle, J. J., & Goldsmith, H. H. (1990). Alternative common factor models for multivariate biometric analyses. Behavior Genetics, 20(5), 569–608.
- McCaffery, J. M., Franz, C. E., Jacobson, K., Leahey, T. M., Xian, H., Wing, R. R., Lyons, M. J., & Kremen, W. S. (2011). Effects of social contact and zygosity on 21-y weight change in male twins. The American journal of clinical nutrition, 94(2), 404–409.
- McCaffery, J. M., Niaura, R., Swan, G. E., & Carmelli, D., (2003). A study of depressive symptoms and smoking behavior in adult male twins from the NHLBI twin study. Nicotine & Tobacco Research, 5(1), 77–83.
- McGue, M., & Carey, B. E. (2017). Gene-environment interaction in the behavioral sciences: Findings, challenges, and prospects. In P. H. Tolan, & B. L. Leventhal (Eds.), Gene-environment transactions in developmental psychopathology: The role in intervention research (pp. 35–57). Cham, Switzerland: Springer International Publishing.
- McGuffin, P., Katz, R., Watkins, S., & Rutherford, J. (1996). A hospital-based twin register of the heritability of DSM-IV unipolar depression. Archives of general psychiatry, 53(2), 129–136.
- Meier, M. H., Slutske, W. S., Heath, A. C., & Martin, N. G. (2011). Sex differences in the genetic and environmental influences on childhood conduct disorder and adult antisocial behavior. Journal of abnormal psychology, 120(2), 377–388.
- Molenaar, D., van der Sluis, S., Boomsma, D. I., Haworth, C. M. A., Hewitt, J. K., Martin, N. G., et al. (2013). Genotype by environment interactions in cognitive ability: A survey of 14 studies from four countries covering four age groups. Behavior Genetics, 43, 208–219.
- Mönkediek, B. (2021). Trait-specific testing of the equal environment assumption: the case of school grades and upper secondary school attendance. Journal of Family Research, 33(1), 115–147.
- Morley, K. I., Lynskey, M. T., Madden, P. A., Treloar, S. A., Heath, A. C., & Martin, N. G. (2007). Exploring the inter-relationship of smoking age-at-onset, cigarette consumption and smoking persistence: genes or environment?. Psychological medicine, 37(9), 1357–1367.
- Morosoli, J. J., Mitchell, B. L., & Medland, S. E. (2022). Chapter12—Methodology of twin studies. In A. Tarnoki, D. Tarnoki, J. Harris, & N. Segal (Eds.), Twin Research for Everyone: From Biology to Health, Epigenetics, and Psychology (pp. 189–214). Elsevier.
- Morris‐Yates, A., Andrews, G., Howie, P., & Henderson, S. (1990). Twins: A test of the equal environments assumption. Acta Psychiatrica Scandinavica, 81(4), 322–326.
- Munsinger, H., & Douglass II, A. (1976). The syntactic abilities of identical twins, fraternal twins, and their siblings. Child Development, 40–50.
- Neale, M. C. (2009). Biometrical models in behavioral genetics. In Y.-K. Kim (Ed.), Handbook of behavior Genetics (pp. 15–33). New York, NY: Springer.
- Neale, M. C., & Maes, H. H. M. (2004). Methodology for genetic studies of twins and families. Dordrecht, NL: Kluwer Academic Publishers.
- Neale, M. C., Walters, E. E., Eaves, L. J., Kessler, R. C., Heath, A. C., & Kendler, K. S. (1994). Genetics of blood-injury fears and phobias: A population-based twin study. American Journal of Medical Genetics, 54(4), 326–334.
- Nes, R. B., Czajkowski, N., & Tambs, K. (2010). Family matters: happiness in nuclear families and twins. Behavior Genetics, 40, 577–590.
- Nikstat, A., & Riemann, R. (2020). On the etiology of internalizing and externalizing problem behavior: A twin-family study. PLoS ONE, 15(3), e0230626.
- O’Connor, T. G., Hetherington, E. M., Reiss, D., & Plomin, R. (1995). A Twin-Sibling Study of Observed Parent-Adolescent Interactions. Child Development, 66(3), 812–829.
- O’Neill, F. A., & Kendler, K. S. (1998). Longitudinal study of interpersonal dependency in female twins. The British Journal of Psychiatry, 172(2), 154–158.
- Penninkilampi-Kerola, V., Kaprio, J., Moilanen, I., & Rose, R. J. (2005). Co-Twin Dependence Modifies Heritability of Abstinence and Alcohol Use: A Population-Based Study of Finnish Twins. Twin Research and Human Genetics, 8(03), 232–244.
- Phillips, K., Fulker, D. W., Rose, R. J., & Eaves, L. J. (1987). Path analysis of seven fear factors in adult twin and sibling pairs and their parents. Genetic Epidemiology, 4(5), 345–355.
- Plomin, R., & Bergeman, C. S. (1991). The nature of nurture: Genetic influence on “environmental” measures. Behavioral and brain sciences, 14(3), 373–386.
- Plomin, R., DeFries, J. C., Knopik, V. S., & Neiderhiser, J. M. (2013). Behavioral Genetics (6th edition). New York, NY: Worth Publishers.
- Plomin, R., Willerman, L., & Loehlin, J. C. (1976). Resemblance in appearance and the equal environments assumption in twin studies of personality traits. Behavior Genetics, 6, 43–52.
- Polderman, T. J., Benyamin, B., De Leeuw, C. A., Sullivan, P. F., Van Bochoven, A., Visscher, P. M., & Posthuma, D. (2015). Meta-analysis of the heritability of human traits based on fifty years of twin studies. Nature Genetics, 47(7), 702–709.
- Posthuma, D. (2009). Multivariate Genetic Analysis. In Y.-K. Kim (Ed.), Handbook of behavior Genetics (pp. 47–60). New York, NY: Springer.
- Posthuma, D., & Boomsma, D. I. (2000). A note on the statistical power in extended twin designs. Behavior Genetics, 30, 147–158.
- Prescott, C. A., Hewitt, J. K., Heath, A. C., Truett, K. R., Neale, M. C., & Eaves, L. J. (1994). Environmental and genetic influences on alcohol use in a volunteer sample of older twins. Journal of Studies on Alcohol, 55(1), 18–33.
- Prescott, C. A., & Kendler, K. S. (1999). Genetic and environmental contributions to alcohol abuse and dependence in a population-based sample of male twins. American Journal of Psychiatry, 156(1), 34–40.
- Rende, R., Slomkowski, C., Lloyd-Richardson, E., & Niaura, R. (2005). Sibling effects on substance use in adolescence: social contagion and genetic relatedness. Journal of Family Psychology, 19(4), 611–618.
- Rhee, S. H., Hewitt, J. K., Young, S. E., Corley, R. P., Crowley, T. J., & Stallings, M. C. (2003). Genetic and Environmental Influences on Substance Initiation, Use, and Problem Use in Adolescents. Archives of General Psychiatry, 60(12), 1256–1264.
- Riemann, R., Angleitner, A., & Strelau, J. (1997). Genetic and environmental influences on personality: A study of twins reared together using the self‐and peer report NEO‐FFI scales. Journal of Personality, 65(3), 449–475.
- Romanov, K., Varjonen, J., Kaprio, J., & Koskenvuo, M. (2003). Life events and depressiveness – the effect of adjustment for psychosocial factors, somatic health and genetic liability. Acta Psychiatrica Scandinavica, 107(1), 25–33.
- Rose, R. J., Kaprio, J., Williams, C. J., Viken, R., & Obremski, K. (1990). Social contact and sibling similarity: Facts, issues, and red herrings. Behavior Genetics, 20(6), 763–778.
- Rose, R. J., Koskenvuo, M., Kaprio, J., Sarna, S., & Langinvainio, H. (1988). Shared genes, shared experiences, and similarity of personality: Data from 14,288 adult Finnish co-twins. Journal of Personality and Social Psychology, 54(1), 161–171.
- Rowe, D. C. (1983). A biometrical analysis of perceptions of family environment: A study of twin and singleton sibling kinships. Child Development, 54(2), 416–423.
- Rowe, D. C. (1994). The limits of family influence: Genes, experience, and behavior. NY: Guilford Press.
- Roy, M.-A., Neale, M. C., & Kendler, K. S. (1995). The Genetic Epidemiology of Self-Esteem. British Journal of Psychiatry, 166(06), 813–820.
- Ruks, M. (2022). Investigating the mechanisms of G × SES interactions for education. Research in Social Stratification and Mobility, 81, 100730.
- Scarr, S. (1968). Environmental bias in twin studies. Eugenics Quarterly, 15, 34–40.
- Scarr, S., & Carter-Saltzman, L. (1979). Twin method: Defense of a critical assumption. Behavior Genetics, 9(6), 527–542.
- Segal, N. L. (2012) Born together-reared apart: the landmark Minnesota twin study. Harvard University Press, Cambridge.
- Segal, N. L. (2013). Personality similarity in unrelated look-alike pairs: Addressing a twin study challenge. Personality and Individual Differences, 54(1), 23–28.
- Segal, N. L., Graham, J. L., & Ettinger, U. (2013). Unrelated look-alikes: Replicated study of personality similarity and qualitative findings on social relatedness. Personality and Individual Differences, 55(2), 169–174.
- Segal, N. L., & Johnson, W. (2009). Twin studies of general mental ability. In Y. Kim (Ed.), Handbook of behavior Genetics (pp. 81–99). New York, NY: Springer New York.
- Segal, N. L., & Pratt-Thompson, E. (2024). Developmental trends in intelligence revisited with novel kinships: Monozygotic twins reared apart v. same-age unrelated siblings reared together. Personality and Individual Differences, 229, 112751.
- Slutske, W. S., Heath, A. C., Dinwiddie, S. H., Madden, P. A. F., Bucholz, K. K., Dunne, M. P., Statham, D. J., & Martin, N. G. (1997). Modeling genetic and environmental influences in the etiology of conduct disorder: A study of 2,682 adult twin pairs. Journal of Abnormal Psychology, 106(2), 266–279.
- Smith, K., Alford, J. R., Hatemi, P. K., Eaves, L. J., Funk, C., & Hibbing, J. R. (2012). Biology, Ideology, and Epistemology: How Do We Know Political Attitudes Are Inherited and Why Should We Care? American Journal of Political Science, 56(1), 17–33.
- Starr, A., & Riemann, R. (2022). Common genetic and environmental effects on cognitive ability, conscientiousness, self-perceived abilities, and school performance. Intelligence, 93, 101664.
- Sunde, H. F., Eilertsen, E. M., & Torvik, F. A. (2024). Understanding indirect assortative mating and its intergenerational consequences. BioRxiv, 2024-06.
- Svensson, D. A., Larsson, B., Waldenlind, E., & Pedersen, N. L. (2003). Shared Rearing Environment in Migraine: Results From Twins Reared Apart and Twins Reared Together. Headache: The Journal of Head and Face Pain, 43(3), 235–244.
- Tambs, K., Harris, J. R., & Magnus, P. (1995). Sex-specific causal factors and effects of common environment for symptoms of anxiety and depression in twins. Behavior Genetics, 25(1), 33–44.
- Tarnoki, A. D., Tarnoki, D. L., Harris, J. R., & Segal, N. L. (Eds.). (2022). Twin Research for Everyone: From Biology to Health, Epigenetics, and Psychology (pp. 189–214). Elsevier.
- Tholin, S., Rasmussen, F., Tynelius, P., & Karlsson, J. (2005). Genetic and environmental influences on eating behavior: the Swedish Young Male Twins Study. The American Journal of Clinical Nutrition, 81(3), 564–569.
- Truett, K. R., Eaves, L. J., Walters, E. E., Heath, A. C., Hewitt, J. K., Meyer, J. M., Silberg, J., Neale, M. C., Martin, N. G., & Kendler, K. S. (1994). A model system for analysis of family resemblance in extended kinships of twins. Behavior Genetics, 24(1), 35–49.
- Tucker-Drob, E. M., & Bates, T. C. (2016). Large Cross-National Differences in Gene × Socioeconomic Status Interaction on Intelligence. Psychological Science, 27(2), 138–149.
- van den Bree, M. B., Eaves, L. J., & Dwyer, J. T. (1999). Genetic and environmental influences on eating patterns of twins aged≥ 50 y. The American Journal of Clinical Nutrition, 70(4), 456–465.
- van der Aa, N., Rebollo-Mesa, I., Willemsen, G., Boomsma, D. I., & Bartels, M. (2009). Frequency of Truancy at High School: Evidence for Genetic and Twin Specific Shared Environmental Influences. Journal of Adolescent Health, 45(6), 579–586.
- Verhulst, B., & Hatemi, P. K. (2013). Gene-environment interplay in twin models. Political Analysis, 21(3), 368–389.
- Verhulst, B., Neale, M. C., Eaves, L. J., Medland, S. E., Heath, A. C., Martin, N. G., & Maes, H. H. (2018). Extended Twin Study of Alcohol Use in Virginia and Australia. Twin Research and Human Genetics, 21(3), 163–178.
- Vinkhuyzen, A. A., van der Sluis, S., de Geus, E. J., Boomsma, D. I., & Posthuma, D. (2010). Genetic influences on ‘environmental’ factors. Genes, Brain, and Behavior, 9(3), 276–287.
- Vinkhuyzen, A. A. E., van der Sluis, S., Maes, H. H. M., & Posthuma, D. (2012). Reconsidering the Heritability of Intelligence in Adulthood: Taking Assortative Mating and Cultural Transmission into Account. Behavior Genetics, 42(2), 187–198.
- Vogler, G. P., & DeFries, J. C. (1986). Multivariate path analysis of cognitive ability measures in reading-disabled and control nuclear families and twins. Behavior Genetics, 16(1), 89–106.
- Wade, T. D., Wilkinson, J., & Ben-Tovim, D. (2003). The genetic epidemiology of body attitudes, the attitudinal component of body image in women. Psychological Medicine, 33(8), 1395–1405.
- Weber, C., Johnson, M., & Arceneaux, K. (2011). Genetics, personality, and group identity. Social Science Quarterly, 92(5), 1314–1337.
- Willoughby, E. A., McGue, M., Iacono, W. G., & Lee, J. J. (2021). Genetic and environmental contributions to IQ in adoptive and biological families with 30-year-old offspring. Intelligence, 88, 101579.
- Wolfram, T., & Morris, D. (2023). Conventional twin studies overestimate the environmental differences between families relevant to educational attainment. npj Science of Learning, 8(1), 24.
- Wolfram, T., Ruks, M., & Spinath, F. M. (2024). Disentangling genetic and social pathways of the intergenerational transmission of cognitive ability–A nuclear twin family study. Research in Social Stratification and Mobility, 100980.
- Woodley of Menie, M. A., Sarraf, M. A., Peñaherrera-Aguirre, M., & Rindermann, H. (2024). Parent-offspring resemblance for educational attainment reduces with increased social class in a global sample: evidence for the compensatory advantage hypothesis. Frontiers in Psychology, 14, 1289109.
- Xian, H., Scherrer, J. F., Eisen, S. A., True, W. R., Heath, A. C., Goldberg, J., Lyons, M. J., & Tsuang, M. T. (2000). Self-reported zygosity and the equal-environments assumption for psychiatric disorders in the Vietnam Era Twin Registry. Behavior Genetics, 30, 303–310.
- Young, S. E., Rhee, S. H., Stallings, M. C., Corley, R. P., & Hewitt, J. K. (2006). Genetic and environmental vulnerabilities underlying adolescent substance use and problem use: General or specific? Behavior Genetics, 36(4), 603–615.
Discover more from Human Varieties
Subscribe to get the latest posts sent to your email.

Leave a Reply