This article reports racial gaps in the LSAT scores for Canada (2019-2023). By using the threshold method designed by La Griffe du Lion (2007), the standardized effect sizes are computed from the proportions of members of each groups who attain specific score ranges. Results are compared with U.S. gaps in the Law School Admission Test (LSAT) and Medical College Admission Test (MCAT) scores. Details of the analysis is available here.
Last year, Canada’s highest court declared a math test, the Mathematics Proficiency Test (MPT), for school teachers to be unconstitutionally racially-biased:
In finding that the MPT infringes s. 15 of the Charter, the Court first concluded that the impact of the MPT creates a distinction based on the enumerated ground of race. The Court highlighted evidence about the circumstances of racialized teacher candidates as well as the results produced by the MPT. In this case, historical knowledge and recent social science studies—including the “detrimental and lasting effects of the residential school system on the province’s Indigenous peoples” and “widespread anti-Black racism” in the Peel District School Board—clearly pointed to the adverse position that Indigenous and Black students experience in the education system. The Court also highlighted the gap between the number of racialized students in Ontario versus the number of racialized teachers, and noted that a lack of diversity in the teaching profession “creates a vicious cycle”. On the impact of standardized teacher testing in general, there were a number of studies cited by the EQAO in its Literature Review that spoke to the disproportionately lower results of racialized test takers compared to their white counterparts.
Chuck and Emil transformed the pass rate data from the court case “Ontario Teacher Candidates’ Council v The Queen” into IQ-metric scores. Their findings revealed an ethnic ranking similar to patterns seen in other school achievement tests, the evidence that the MPT revealed some uncomfortable facts. These results raise the question of whether similar trends appear on other selection tests. The Canadian judiciary may find such information pertinent, given its stance on the constitutionality of exams that show significant ethnic discrepancies.
LSAC, which administers the Law School Aptitude Test (LSAT) published 5-year reports for both the USA and Canada. The Law School Admission Council reported the number of cases by race/ethnicity (Whites, Blacks, Asians, Hispanics, Aboriginals) in Canada from 2019 to 2023 who achieve the following LSAT score range: <140, 140-144, 145-149, 150-154, 155-159, 160-164, 165+. Numbers taken from the LSAC report in the Canadian Volume. How do we calculate standardized effect sizes given these numbers? In 2007, La Griffe du Lion came up with a threshold method, which calculates such effect sizes when given the proportion of two groups who attain some threshold of cognitive achievement. Jordan Lasker (2022) created a series of functions to implement it. In fact, he even computed these d gaps. Below I display these numbers for each minority groups with respect to Whites.
[After posting this analysis, LSAC altered their tool and now only report data for Canadians applying to Canadian schools. Screenshots of the original Canadian data are available at this link.]
Canada: LSAT gaps
| Cohen’s d | SD ratio | |||||||
| year | Asian | Hispanic | Black | Aborigin | Asian | Hispanic | Black | Aborigin |
| 2019 | 0.143 | 0.429 | 0.786 | 0.691 | 1.138 | 1.035 | 1.102 | 1.162 |
| 2020 | 0.135 | 0.506 | 0.839 | 0.658 | 1.157 | 1.011 | 1.161 | 1.124 |
| 2021 | 0.163 | 0.397 | 0.829 | 0.553 | 1.000 | 1.044 | 1.093 | 1.226 |
| 2022 | 0.094 | 0.343 | 0.889 | 0.623 | 1.172 | 1.060 | 1.092 | 1.058 |
| 2023 | 0.065 | 0.361 | 0.885 | 0.705 | 1.166 | 1.074 | 1.104 | 1.118 |
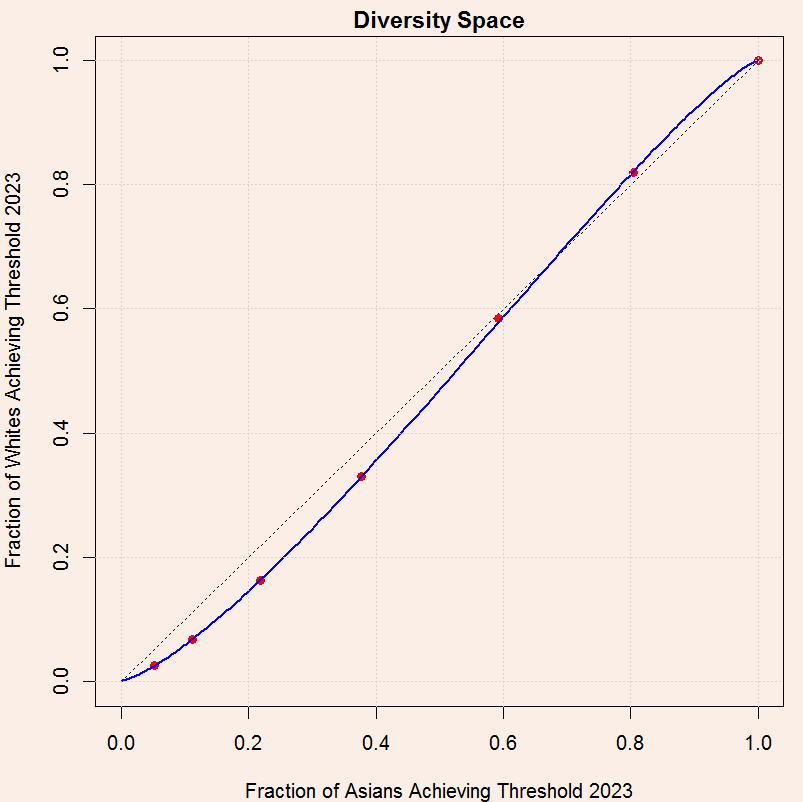
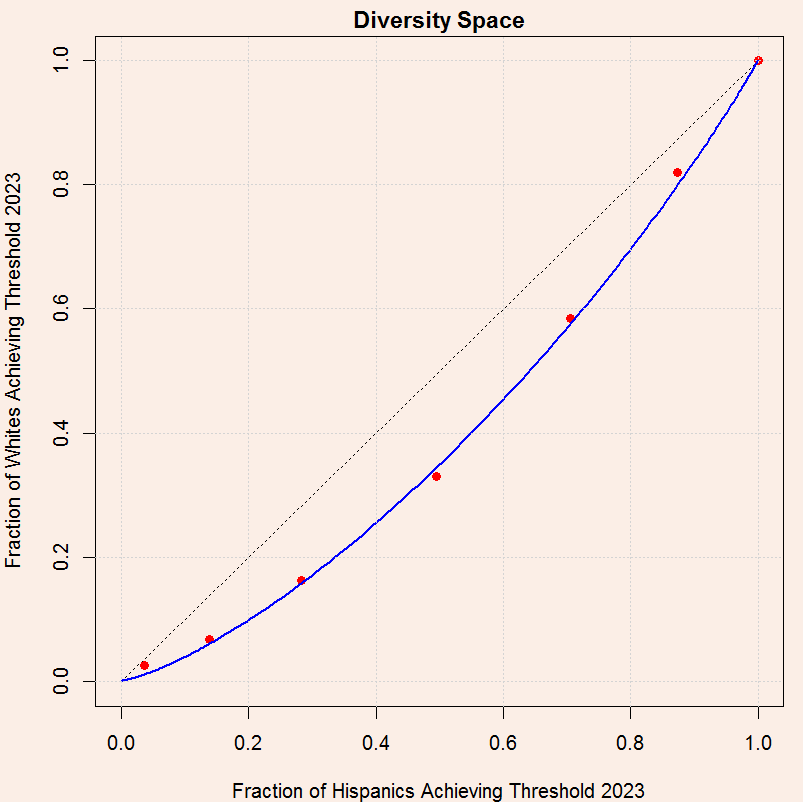
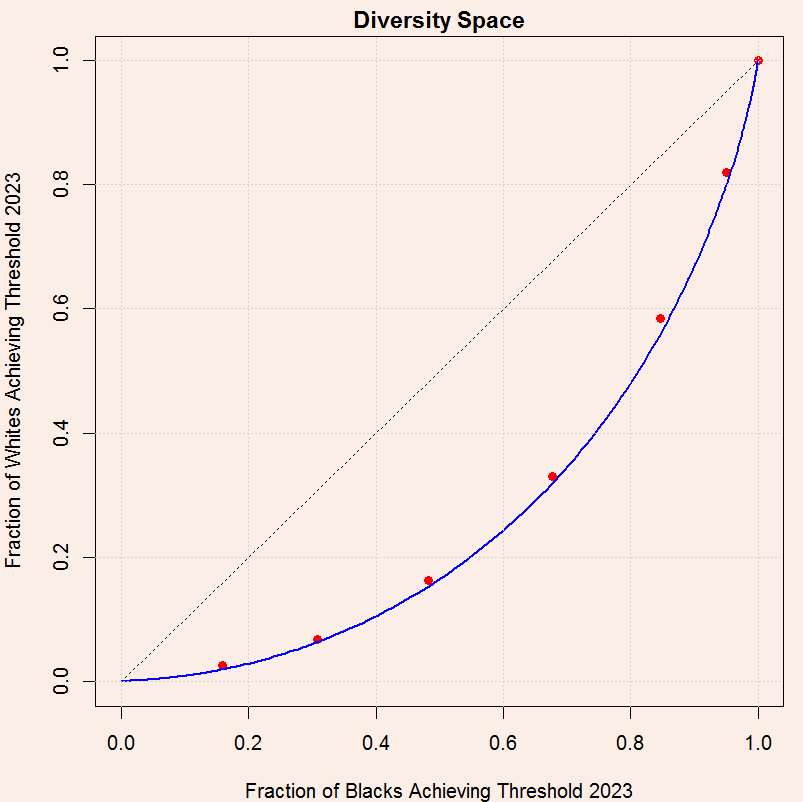
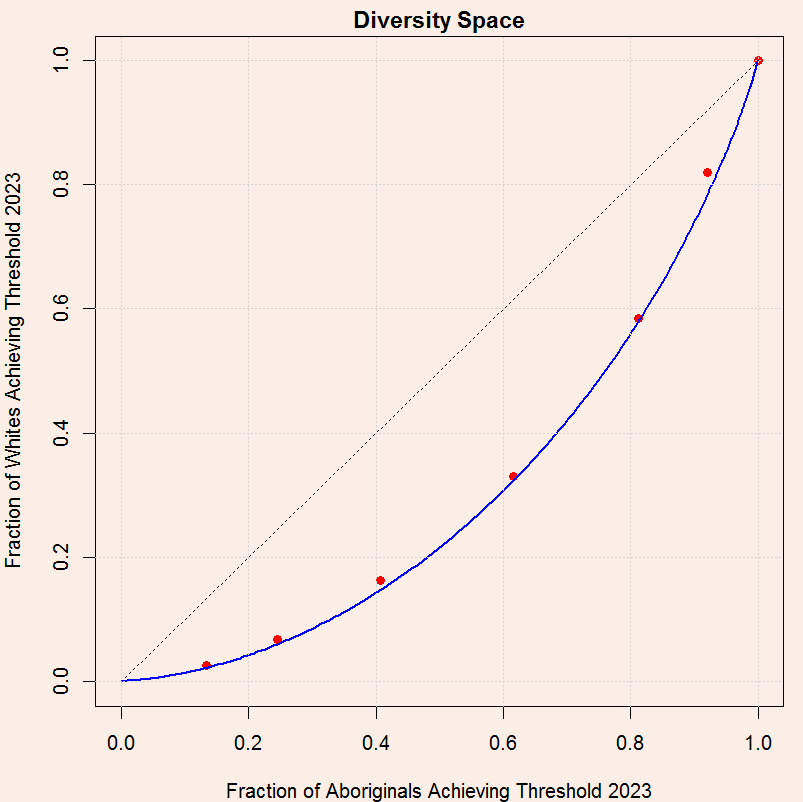
La Griffe’s threshold is graphically displayed below:
How to read the curve? The red dots display the percentage of each groups to attain a specific threshold. The percentages are cumulative across the dots. For instance, the fractions of aboriginals (or indigenous) attaining the first, second, third thresholds are .13, . 11 and .16, which totals 0.4 in the X axis while the fractions of whites attaining the same thresholds are .025, .04, . 095, which totals .16 in the Y axis. If the two groups have equal probabilities (or percentages) then the red dots should be in perfect alignment with the diagonal. To put it simply, if the dots are placed below the diagonals, the group on the X axis has a disadvantage.
La Griffe describes the concept as follows:
In diversity space, specific thresholds of achievement are not specified. The point (0.6, 0.4) could arise from any mental challenge met by 60% of Group A and 40% of Group B. Such a challenge might, for example, be passing the bar exam or reaching 1200 on the SAT. The possibilities are countless, the details not important. Points in diversity space are not test specific. They are ability specific.
The racial score gap averaged over 5 years is displayed below:
| LSAT averaged over 2019-2023 in IQ metric | |||||
| Asian | Hispanic | Black | Aborigin | White | |
| Mean | 98.20 | 93.89 | 87.32 | 90.31 | 100 |
| N | 9977 | 926 | 2009 | 1107 | 18472 |
One striking pattern is the small White-Asian LSAT score gap. Perhaps the LSAT is less preppable than the SAT. Another explanation is the composition of the test. The LSAT is composed of four 35-minute sections: reading comprehension, logical reasoning A and B, analytical reasoning. Their description clearly point to the lack of a math section.
- Reading Comprehension: Tests ability to draw inferences based on text, determine main ideas of passages, find relevant information within a text, understand a dense, scholarly text.
- Logical Reasoning: Tests ability to determine main points of arguments, apply logic to abstract concepts, find relevant information within a text, and analyze and evaluate arguments.
- Analytical Reasoning: Tests ability to understand effects of rules on decisions and outcomes, determine relationships between concepts, analyze situations and draw conclusions based on set guidelines, and apply logic to ambiguous or complex situations.
It is well known that the math section of the SAT has been a strong suit for asian americans. This seems to be no different in Canada. Barber et al. (2021, Table 2) analyzed the canadian NLSCY data. Participants were given a shortened version of the Mathematics Computation Test from the standardized Canadian Achievement Test. They use a regression analysis with dummy race variables. The model without background adjustment shows a z-score difference of -.444 for indigenous, -.452 for blacks, .112 for south asian, .487 for chinese and -.022 for other (negative value indicates disadvantage). An issue with the data is the large number of missing values due to the test being administered to students only if parents consent to its administration. After applying a Heckman selection model (Table 4), the corrected gap is smaller for indigenous and blacks but unchanged for chinese and other groups. I do not report the gaps because they apply the Heckman model with adjustment for social background.
U.S.: LSAT and MCAT gaps
One could check whether the racial gaps in the LSAT are any different in the United States. The LSAT scores from the U.S. by race/ethnicity from 2007-08 to 2017-18 were taken from Dalessandro et al. (2014, Table 4A-4B) and Lauth & Sweeney (2022, Table 4). Cohen’s d was computed using the pooled SD and then converted into an IQ scale with the White group at score 100.
| 2007-08 | 2008-09 | 2009-10 | 2010-11 | 2011-12 | 2012-13 | 2013-14 | 2014-15 | 2015-16 | 2016-17 | 2017-18 | |
| Am.Indian | 92.45 | 91.89 | 90.37 | 90.43 | 88.56 | 89.46 | 89.08 | 88.84 | 87.64 | 87.52 | 87.04 |
| Asian | 99.12 | 98.58 | 99.23 | 99.34 | 99.79 | 99.09 | 99.81 | 99.45 | 99.25 | 99.84 | 99.48 |
| Black | 82.41 | 82.07 | 82.45 | 82.00 | 82.06 | 81.98 | 82.30 | 81.90 | 82.14 | 81.43 | 81.31 |
| Aborigin | 96.48 | 95.34 | 100.1 | 97.51 | 93.95 | 89.39 | 100.6 | 92.62 | 84.35 | 102.4 | 88.01 |
| Hawaiian | 89.68 | 87.06 | 89.45 | 88.68 | 87.16 | 87.12 | 90.81 | 89.33 | 86.02 | ||
| Hispanic | 89.60 | 89.50 | 89.72 | 89.35 | 89.55 | 88.81 | 88.76 | 88.76 | 88.78 | 88.54 | 88.13 |
| Puerto R. | 76.89 | 76.09 | 76.80 | 76.74 | 76.17 | 77.36 | 78.36 | 79.17 | 80.19 | 79.41 | 79.98 |
| White | 100 | 100 | 100 | 100 | 100 | 100 | 100 | 100 | 100 | 100 | 100 |
| Mult. Race | 96.72 | 95.45 | 94.95 | 94.94 | 94.81 | 94.42 | 94.92 | 94.02 | 94.34 | ||
| No report | 105 | 105 | 103 | 104.7 | 104.6 | 103.5 | 102.7 | 102.5 | 102.8 | 101.9 | 102 |
The White-Asian gap is similar, but the White-Black and White-Hispanic gaps are larger in the U.S. On the other hand, the magnitude of the racial gaps stays constant during this period. One might wonder if other exams show a similar pattern. The Medical College Admission Test scores (MCAT) in the U.S. from 2013 to 2022, taken from the AAMC reports, display similar racial gaps.
| 2013 | 2017 | 2021 | 2022 | ||
| IQ | IQ | IQ | IQ | ||
| White | 100 | 100 | 100 | 100 | |
| Asian | 99.03 | 99.70 | 101.71 | 102.23 | |
| Black American | 84.43 | 86.07 | 86.57 | 82.07 | |
| Hispanic/Latino | 88.46 | 90.02 | 94.09 | 86.60 | |
| Am. Indian or Alaska Nat | 91.87 | 91.58 | 88.41 | 83.77 | |
| Native Hawaiian or PI | 89.59 | 93.88 | 91.48 | 89.59 | |
| Two or more races | 99.64 | 95.76 |
The argument that cognitive and scholastic tests are racially biased because there are group differences in the scores never gets old. Suto et al. (2012, Table 7) investigated the predictive validity of LSAT across races. While LSAT alone emerges as fairly accurate predictor of law school performance for Whites, it tends to slightly overpredict the performance of Asians, Blacks and Hispanics. When undergraduate GPA was used alongside LSAT, the difference in prediction diminishes, especially for Blacks. The same conclusion is reached when one examines the MCAT. Davis et al. (2013) report a black-white gap for MCAT (d=1.0) similar to LSAT (d=1.1) in 2009. Their regression analyses do not show underprediction of MCAT scores on medical school performance for either Black or Hispanic students. Busche et al. (2020, Table 2) similarly found no differential prediction between the under-represented minority (not including asians) and majority groups as well as between bachelor degree and no-bachelor degree parent groups, when using validity sample or national population of the 2016 matriculants. Hanson et al. (2022, Table 4) found that MCAT did not over- or underpredict performance for under-represented minority group or no-bachelor degree parent group but also that using MCAT+UGPA as opposed to MCAT alone leads to even smaller difference in predicted outcome.
The similarity in predictive validity over time as well as the magnitude of group differences is worth mentioning given that the MCAT has been redesigned since 2015 to reflect changes in society. According to Busche et al. (2020), “The new exam still tests foundational concepts in biology, chemistry, and physics, along with verbal reasoning skills; now, it also includes concepts from first-semester biochemistry and introductory psychology and sociology. The new exam also requires applicants to demonstrate more scientific reasoning skills than the old exam did.”
References
- Busche, K., Elks, M. L., Hanson, J. T., et al. (2020). The validity of scores from the new MCAT exam in predicting student performance: Results from a multisite study. Academic Medicine, 95(3), 387-395.
- Dalessandro, S. P., Anthony, L. C., & Reese, L. M. (2014). LSAT Performance With Regional, Gender, and Racial-Ethnic Breakdowns: 2007-2008 Through 2013-2014 Testing Years.
- Davis, D., Dorsey J. K., Franks, R. D., Sackett, P. R., Searcy, C. A., Zhao, X. (2013). Do racial and ethnic group differences in performance on the MCAT exam reflect test bias? Acad Med. 88:593–602.
- Girotti, J. A., Chanatry, J. A., Clinchot, D. M., et al. (2020). Investigating group differences in examinees’ preparation for and performance on the new MCAT exam. Academic Medicine, 95(3):365–374.
- Hanson, J. T., Busche, K., Elks, M. L., Jackson-Williams, L. E., Liotta, R. A., Miller, C., … & Yuan, K. (2022). The validity of MCAT scores in predicting students’ performance and progress in medical school: results from a multisite study. Academic Medicine, 97(9), 1374-1384.
- Lauth, L. A., & Sweeney, A. T. (2022). LSAT Performance With Regional, Gender, and Racial and Ethnic Breakdowns: 2011-2012 Through 2017-2018 Testing Years.
- Suto, D., Norton, L., & Reese, L. (2012). Analysis of differential prediction of law school performance by racial/ethnic subgroups based on 2008–2010 entering law school classes. LSAC Technical Report (TR 12-02). Newtown, PA: Law School Admission Council.
Discover more from Human Varieties
Subscribe to get the latest posts sent to your email.


Leave a Reply