Month: June 2014

Ethnic/Race Differences in Aptitude by Generation in the United States: An Exploratory Meta-analysis

An early version of this paper was posted on June 25th. The paper has since been extensively edited and corrected and, subsequently, published at Open Differential Psychology on July 25/26th, 2014. The paper and data files can be found here at the Open Differential Psychology site.

PDF.

Abstract

Cognitive ability differences between racial/ethnic groups are of interest to social scientists and policy makers. In many discussions of group differences, racial/ethnic groups are treated as monolithic wholes. However, subpopulations within these broad categories need not perform as the racial/ethnic groups do on average. Such subpopulation differences potentially have theoretical import when it comes to causal explanations of racial/ethnic differentials. As no meta-analysis has previously been conducted on the topic, we investigated the magnitude of racial/ethnic differences by migrant generations (first, second, and third+). We conducted an exploratory meta-analysis using 18 samples for which we were able to decompose scores by sociologically defined race/ethnicity and immigrant generation. For Blacks and Whites of the same generation, the first, second, and third+ generation B/W d-values were 0.79, 0.79, and 1.00. For Hispanics and Whites of the same generation, the first, second, and third+ generation H/W d-values were 0.76, 0.67, and 0.57. For Asians and Whites of the same generation, the first, second, and third+ generation d-values were -0.08, -0.21, and 0.00. Relative to third+ generation Whites, the average d-values were 0.99, 0.84, and 1.00 for first, second, and third+ generation Black individuals, 1.04, 0.71, and 0.57 for first, second, and third+ generation Hispanic individuals, 0.16, -0.18, and -0.01 for first, second, and third+ generation Asian individuals, and 0.24 and 0.04 for first and second generation Whites.

Keywords: Immigrants, group differences, race, ethnicity, aptitude, National IQ
Continue reading

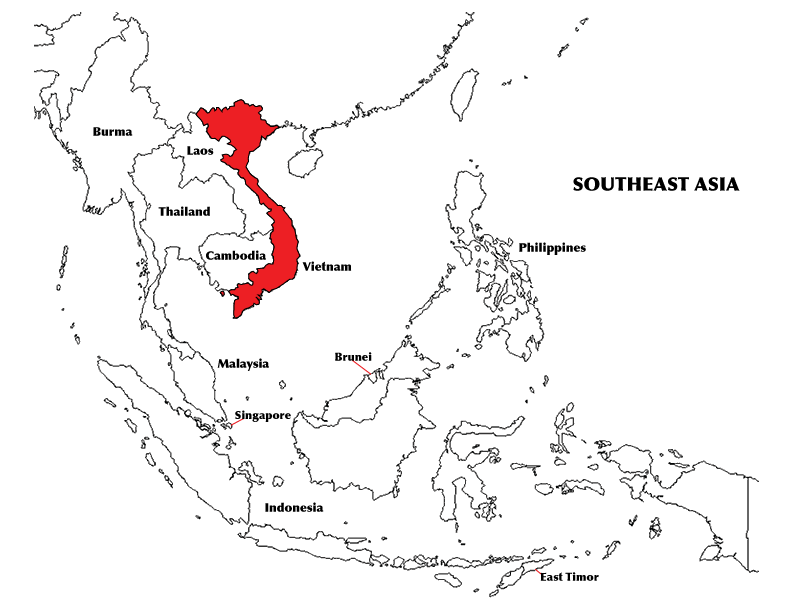
HVGIQ: Vietnam

Richard Lynn and Tatu Vanhanen did not have a study for Vietnam in IQ and the Wealth of Nations (2002). Then, beginning with their follow-up book, IQ and Global Inequality (2006), Lynn added a bogus study for Vietnam and gave the world’s 13th most populous country a made-up national IQ of 94. In short, Lynn’s dataset does not have an IQ study for Vietnam.

In this post I review two dozen intelligence and achievement test studies for Vietnam and Vietnamese populations living internationally. While IQ in Vietnam is lower than I anticipated, there is evidence that Vietnamese people have high intellectual potential.

Continue reading

HVGIQ: Turks and Caicos Islands

The Turks and Caicos Islands is classified as a British Overseas Territory (other examples are Bermuda and the Cayman Islands). It has a population of 32,000, and its demographics are 88% black and 8% white. Like many small Caribbean territories, the Turks and Caicos Islands enjoy a high standard of living fueled by finance and tourism.

Lynn & Vanhanen do not have a study for this territory and, with the exception of Bermuda, they don’t include British Overseas Territories in their full dataset of estimated scores.

In this short post I summarize one study for the Turks and Caicos Islands.
Continue reading

HVGIQ: Cambodia

Much like Burma, Cambodia is a populous Southeast Asian country with a toxic authoritarian government, and routinely shows up at the back of human development indices. Richard Lynn’s international IQ dataset likewise does not yet have a study for this country.

Lynn & Vanhanen (2002, p. 74) make an IQ estimate of 89 for Cambodia by averaging together scores from its regional neighbors Thailand (91) and the Philippines (86). IQ and Global Inequality (2006, p. 56) revises this estimate to 91 by averaging together scores from three neighbors: Laos (89), Thailand (91), and Vietnam (94). Lynn & Vanhanen’s most recent update (2012, p. 21) assigns Cambodia an IQ of 92, but it’s not entirely clear why, as this book no longer lists the nations used to generate regional estimates. Presumably it’s the rounded average of Laos (89) and Vietnam (94).

In this post I present several different intelligence studies from Cambodia, as well some data for U.S. immigrants. These studies suggest that Cambodia has one of the lowest IQs in the world, but their achievement test scores in the U.S. exceed blacks and Hispanics.
Continue reading

The Fallacy of Significance Tests

It must be known that a p-value, or any other statistics based on the Chi-Square, is not a useful number. It has two components : sample size and effect size. Its ability to detect a non-zero difference increases when either sample size or effect size increases. If only sample size increases, even with the other left constant, the statistics become inflated. There is also a problem with the assumption. If it is about the detection of “non-zero” difference, it is of no use if the magnitude, i.e., effect size, is of no importance. I will provide several examples of the deceptiveness of significance tests.
Continue reading

Multiple Regression, Multiple Fallacies

It goes without saying that multiple regression is one of most popular and applied statistical methods. Thus, it would be odd if most practitioners among scientists and researchers do not understand and misapply it. And yet, this provocative conclusion seems most likely.

Because a simple bivariate correlation does not disentangle confounding effects, the multiple regression is said to be preferred. The technique attempts to evaluate the strength of an independent (predictor) variable in the prediction of an outcome (dependent) variable, when controlling, i.e., holding constant, every other variables entered (included) as independent variables into the regression model, either progressively step by step or altogether at the same time. The rationale is to get the effect of an independent variable that only belongs to it. But this is a fallacy.
Continue reading

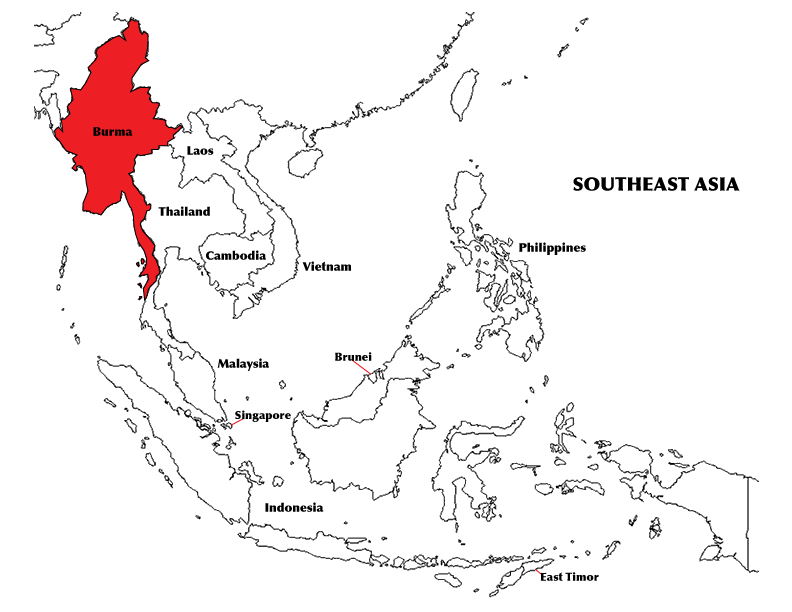
HVGIQ: Burma

Burma, also known as Myanmar, has a population of over 60 million, and is the world’s 24th most populous nation. With an authoritarian, military-controlled government, it is also one of the poorest and most dysfunctional places on earth—you will find it nestled together with mostly African countries at the back of most human development rankings.

Richard Lynn’s international dataset does not yet have a study for Burma. IQ and the Wealth of Nations (2002, p. 74) makes an estimate of 86 by averaging together IQ from neighboring India (81) and Thailand (91). IQ and Global Inequality (2006, p. 59) bumps up India’s IQ to 82, which changes the Burma estimate to 87. The latest version of the dataset (Lynn & Vanhanen, 2012, p. 26) assigns a lower IQ to Thailand (88), which means that Lynn’s most recent estimate for Burma is 85.

I was able to locate one published intelligence study for Burma. The results are surprising, but the research contains no obvious flaws. Intellectual potential in Southeast Asia is an issue filled with contradiction and uncertainty.
Continue reading

© 2024 Human Varieties

Theme by Anders NorenUp ↑