Following up with a previous analysis, I examined the cognitive variation across the whole of the Americas using a newly constructed data set. Files can be found here and here, with the latest versions provided on request. The analysis was restricted to sovereign nations, not e.g., departments such as Martinique or territories such as the Virgin Islands. Non-sovereign regions were excluded so to avoid an inter-nation x intra-national interaction and because international exam data was not available for these regions. The following 35 countries were included: Argentina, Antigua and Barbuda, Bahamas The, Belize, Bolivia, Brazil, Barbados, Chile, Colombia, Costa Rica, Cuba, Dominica, Dominican Republic, Ecuador, Guyana, Grenada, Honduras, Haiti, Jamaica, St. Kitts and Nevis, St. Lucia, Mexico, Nicaragua, Panama, Peru, Paraguay, El Salvador, Suriname, Trinidad and Tobago, Uruguay, United States, St. Vincent, Venezuela RB, and Canada. Eight regression analyses were run, using the following dependent variables:
- (Skinrefl) Skin reflectance.
- (AchQ) National Achievement Scores – this was an updated set provided by Gerhard Meisenberg during October of 2014.
- (NIQ) National IQ scores – these were based on Richard Lynn’s 2014 (work in progress) results and Jason Malloy’s 2013 to 2014 estimates, with adjustments.
- (AHQ) 1880 to 1930 birth cohort age heaping scores — this is a measure of education/numeracy.
- (logSciresearch) Log of scientific researchers from 2005 to 2012.
- (logGDP) Average of 1990, 2000, and 2010 log of World Bank per capita GDP.
- (Crimes) Violent Crime rates.
- (HDI2012) 2012 Human Development Index scores.
The following independents were included:
- (relativeEu) European Ancestry percent — the percent of European ancestry out of the percent of European + Amerindian + African ancestry. (For a discussion of this variable, refer here.)
- (notUSCanada) Not US or Canada — whether the region was not US or Canada.
- (logparasiteload) Log Parasite load — the log of the 2004 WHO parasite infections per 100,000 for each country.
- (logColddemand) Log Cold demand — the log of Van de Vliert’s (2013) cold stress scores.
- (PopUnder1million) Population under 1 million — whether the country’s population was under one million.
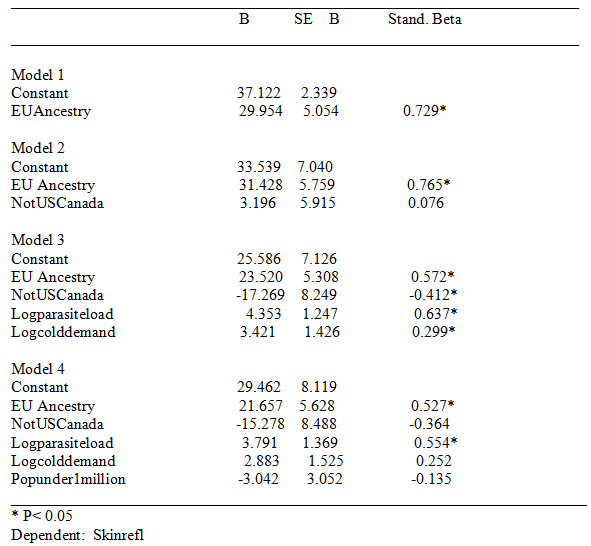
Simple correlation analysis demonstrated that ancestry, cold weather, and parasite load intercorrelated. This situation renders difficult the isolation of causal associations. To illustrate, skin reflectance was set as a dependent with Eu ancestry, cold weather, parasite load, population under 1 million, and not US and Canada as independents. The correlation between Eu ancestry and skin reflectance is clearly mostly genetic in origin. To the extent that the association between ancestry and skin reflectance is mediated by other variables, it is suggested that these variables co-vary with causal effects related to genes (and thus that controlling for them controls for ancestry related causal effects). Regression results are shown in Table 1, below. Generally, parasite load and cold weather seem to partially index ancestry effects. Parasite load is a particularly problematic “environmental factor” because it significantly correlates with STD and HIV rates (at 0.47). Yet the spread of HIV throughout the Americas, in the ’70s and ’80s, was subsequent to the origin of cognitive ability differences, which, in the form of national age heaping rates, were already present in the 1800s. Thus, STD and HIV rates and with them parasite load are, to some extent, consequent of cognitive ability differences.
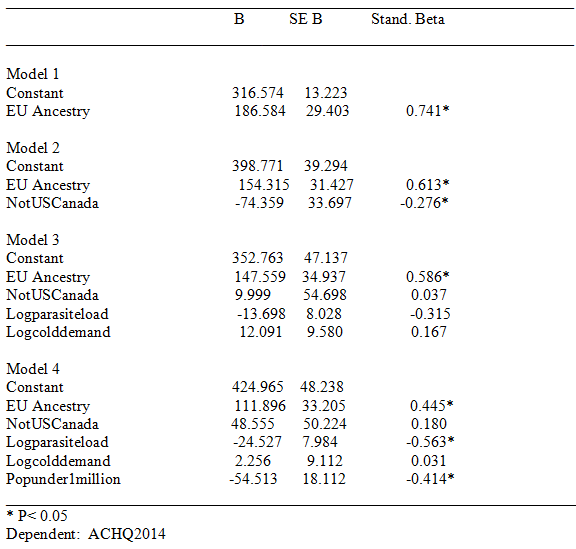
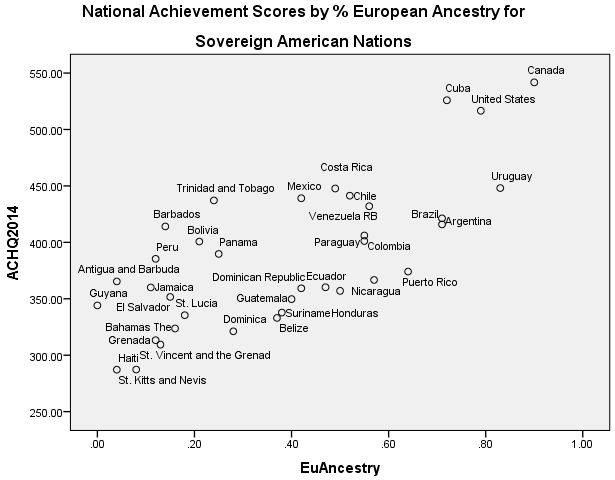
Results will not be discussed in detail. The data file is made freely available; readers can run the analyses as desired. Generally, European ancestry was a robust predictor of lower rates of violent crime, scientific activity, and achievement scores, and achievement plus National IQ scores. (For national IQ alone, in the final model, none of the predictors were significant; this was because the NIQ sample had many missing values.) In contrast to cognitive ability and the other mentioned indexes, European ancestry was generally not significantly associated with GDP or Human developmental indexes. The results for National achievement scores are shown in Table 2, below; a regression plot is shown in figure 1.
Table 1. Regression Results for Skin reflectance

Table 2. Regression Results for ACHQ2014

Figure 1. National Achievement Scores by % European Ancestry for Sovereign American Nations


