Category: Hispanic-White IQ Gap (Page 2 of 2)

Is IQ Heritability Moderated by Race? An Analysis of the CNLSY Sample

The strong heritability of IQ is well established for white populations in America, with dozens of studies confirming the basic findings. When it comes to heritability in non-whites, the handful of studies that exist (see Jensen 1998, p. 446ff.; Rowe et al. 1999; Guo & Stearns 2002; cf. John’s recent post) do not allow us to conclude that heritability is lower (or higher) in non-white Americans than it is among white Americans, but there is a sore need for more research.

To diminish this uncertainty, we compared the heritability of several different cognitive abilities in whites, blacks, and Hispanics in the CNLSY sample. The sample, which consists of the children of the mothers who are part of the NLSY79 study, includes the results of various ability tests administered between ages 3 and 13. Continue reading

HVGIQ: Puerto Rico

The Commonwealth of Puerto Rico is a Spanish-speaking territory of the United States. Puerto Ricans are United States citizens—they can freely migrate between the island and the states, join the military, or even run for president. But they can’t vote for president, because the territory is not a U.S. state. In three referendums from 1967 to 1998, Puerto Rican voters rejected both political independence and U.S. statehood. However, in November 2012 a solid majority (61.3%) voted in favor of statehood. This kind of political nudging could quite possibly result in Puerto Rico becoming the 51st U.S. state … but only Congress and the president have authority over the matter, and analysts agree that approval is unlikely. This particular referendum also left off the option traditionally most favored by Puerto Ricans: continued commonwealth status. Many islanders appear to feel that statehood offers few additional benefits over citizenship; a majority of Puerto Ricans already live on the U.S. mainland (5 million vs. 3.7 million).

From the earliest days of intelligence testing, social scientists have taken a special interest in U.S. Hispanics. Proportionate to their numbers, it’s possible that more tests have been given to Hispanics than to blacks. But this special attention has also lacked focus. African-American test results have been subject to meticulous cataloging, synthesis and analysis (Shuey, 1966; Jensen, 1998; Jencks & Phillips, 1998) leading to somewhat of a consensus on the size and shape of the black-white cognitive performance gap. Yet there has not been a similar effort to process the disparate and voluminous literature on the abilities of U.S. Hispanics. Therefore there is less knowledge and consensus about the historical and contemporary test performance of Hispanic minorities.

Most of the U.S. Hispanic population is Mexican American (63%). Puerto Ricans are the second largest Hispanic minority (9.2% … or 15.3% including the Commonwealth). This post represents the first effort to comprehensively summarize the abilities of one of these two important American minority groups. Here I describe and analyze the results from over 70 studies that have measured the abilities of Puerto Ricans.

Continue reading

ACE Analysis of the NLSY79 AFQT by Race/Ethnicity

Much has been written about social class differences in the heritability of cognitive ability, little about racial and ethnic differences. I will leave a review of the issue, a discussion of our meta-analytic results, and a report of our technically complex CNLSY ACE x race/ethnicity analysis to my more loquacious (and apt) colleagues. Here I present results based on the (effectively) small NLSY79 kinship sample.
Continue reading

Racial Differences on Digit Span Tests

In digit span tests, the respondents are asked to repeat a string of digits. There are two variants of the test, forward digit span (FDS) and backward digit span (BDS). In FDS, the digits are repeated in the order of their presentation, while in BDS they must be repeated in the reverse order. The largest number of digits that a person can repeat without error is his or her forward or backward digit span.

It is well-established that the black-white gap is substantially larger on BDS than FSD (see references in The g Factor by Jensen, p. 405, Note 22; see also my recent analysis of the DAS-II). However, replication is always good, so I analyzed black-white differences in the CNLSY sample, which contains FDS and BDS scores for relatively large samples of black and white children. Additionally, I compared the digit span performance of Hispanic American children to that of blacks and whites. Continue reading

Spearman's Hypothesis and Racial Differences on the DAS-II

According to Spearman’s hypothesis, the magnitude of the black-white gap on a given cognitive ability test is primarily determined by the test’s g loading. Tests that are better measures of g are associated with larger gaps.

The Differential Ability Scales, Second Edition, or the DAS-II, is an IQ test for assessing children and adolescents. It comprises a total of 21 subtests, although in the present analysis only 13 subtests are used, because not all tests are administered across age groups. I will use the method of correlated vectors (MCV) to test whether g loadings are correlated with mean racial differences on the DAS-II subtests. In addition to the black-white gap, I will also investigate if the test performance of Asians and Hispanics is predicted by g loadings. Continue reading

An Analysis of the NLSY79 and NLSY97 Full Sibling Correlations by Race

In his classic work, Educability and Group Differences, Arthur Jensen presented a number of lines of evidence in defense of his thesis that the Negro-White difference in psychometric intelligence had a congenital component. On the basis of full sibling correlations and relations, Jensen offered the following arguments:

(a1) The full sibling correlations for Blacks and Whites are comparable; (a2) unshared environmental hypotheses, such as nutritional ones, would predict otherwise (pg. 338-339).

(b1) The full sibling correlations for Blacks and Whites are comparable; (b2) a shared environmental hypothesis of group differences would predict otherwise, assuming that the within population heritablities were the same (pg. 108-109).

(c1) The average absolute difference between full siblings is no greater for Blacks than for Whites; (c2) unshared environmental hypotheses, such as nutritional ones, would predict otherwise (pg. 338-339).

(d1) When matching Blacks and Whites on IQ, one sees differential sibling regression, a differential regression which does not decrease with increasing IQ; (d2) an environmental hypothesis of group differences would not predict this (pg. 118-119). Continue reading

Spearman’s hypothesis and the NLSY97-ASVAB, part 2

Skin color is a (very imperfect) proxy for white ancestry in African Americans and Hispanics. If racial and ethnic gaps in intelligence have a genetic component, we would expect lighter skinned individuals to have higher IQs, on the average. Further, because g is the main heritable component of intelligence, tests with higher g loadings should show larger associations with skin color.

We investigated these hypotheses in the NLSY97 sample. It contains interviewer reports on facial skin tone of the respondents as measured on a scale of 1 (lightest) to 10 (darkest). The interviewers used a “color card” as a reference.

All the correlations below are significant at conventional levels unless otherwise indicated. Because of the way skin color is coded in this analysis, negative correlations between skin color and test performance are expected if the hereditarian hypothesis is correct.

I found that among blacks, the correlation between g scores and skin color (darkness) was -0.133 (N=1856), whereas T scores were unrelated to skin color (r=-0.012, ns; N=1856). Among Hispanics, g scores correlated with skin darkness at -0.123 (N=1051), while T scores were unrelated to skin color (r=0.062, ns; N=1051). Therefore the results are about as expected. (See the previous post for information about the T factor.)

Applying again the method of correlated vectors (MCV), we found that vectors of skin color-test gap correlations were strongly and significantly associated with g loadings within populations. In other words, lighter-skinned individuals tended to outscore darker-skinned coracials/coethnics more on tests with higher g loadings. Among blacks, the correlations were r=-0.84 and rho=-0.75, and among Hispanics r=-0.60 and rho=-0.59 (correcting for unreliability would make all these correlations somewhat stronger).

The MCV results could be interpreted in terms of genetic effects: tests with higher g loadings are more heritable, and skin color is a proxy for white ancestry and thus presumably better “IQ genes”. But why would these within-population color analyses produce the expected correlations between g loadings and race markers (i.e., skin tone) when the between-population MCV analysis, presented in the previous post, did not? It appears that on the ASVAB g is the major source of racial/ethnic differences, but the T factor also contributes to the gaps. (Cohen’s d’s on the g scale were B-W 1.124, B-H 0.368, and H-W 0.759, while on the T scale they were B-W 0.561, B-H 0.261, and H-W 0.306.) However, T is not associated with skin color within populations, which suggests that its heritability is low and it is linked to race and ethnicity for non-genetic reasons. This would explain why the MCV results from within- and between-population analyses differ.

In the NLSY97, higher g is associated with lighter skin among blacks and Hispanics. This is in accord with hereditarian theory, but nurturists would of course argue that these correlations are due to colorism. These competing hypotheses could be tested by comparing skin color-IQ associations within and between families, as was done here.

Spearman's hypothesis and the NLSY97-ASVAB, part 1

According to Spearman’s hypothesis, black-white gaps on cognitive tests are larger on tests that are better measures of g, or general mental ability. If g is the only or main source of the black-white gap, it indicates that within- and between-race differences are qualitatively similar and that understanding the nature of the racial gap requires that we understand the nature of g.

One of the ways that the late Arthur Jensen used to test the hypothesis was the method of correlated vectors (MCV). It involves factor analyzing a battery of cognitive tests taken by a sample of individuals from different races, and correlating the resultant vector of g loadings with the magnitudes of racial differences on each subtest of the battery. The expectation is that tests with higher g loadings are associated with larger racial gaps. Jensen did a number of analyses of this kind, and found that the average correlation between g loadings and subtest differences across many different samples of blacks and whites was 0.63 (after correction for unreliability), supporting the notion that g is the main source of the black-white gap. Analyses of Hispanic-white gaps have also generally supported the idea that g is their major source.

John Fuerst and I studied Spearman’s hypothesis in the NLSY97 sample. The sample sizes in the NLSY97 are ~4400 for whites, ~2300 for blacks, and ~1800 for Hispanics, although they may be lower in specific analyses below. We mostly followed the procedures in Nyborg & Jensen 2000, although we used principal axis factoring rather than PCA. The NLSY97 participants took the ASVAB, which comprises the following tests:

General Science (GS)
Arithmetic Reasoning (AR)
Word Knowledge (WK)
Paragraph Comprehension (PC)
Numerical Operations (NO)
Coding Speed (CS)
Auto Information (AI)
Shop Information (SI)
Mathematics Knowledge (MK)
Mechanical Comprehension (MC)
Electronics Information (EI)
Assembling Objects (AO)

The ASVAB yielded a similar two-factor structure across the black, white, and Hispanic samples. The first factor, which we identified as g, explains about 60 percent of the variance in the ASVAB, while the second factor explains about 10 percent; the rest can be regarded as test-specific variance and measurement error. The second factor is not very easily interpretable, but I would tentatively consider it as representing technical knowledge because it has some of its highest loadings on the Auto and Shop Information tests, which have questions like this:

A fuel-injected engine does not need:

(A) spark plugs
(B) a fuel pump
(C) a carburetor
(D) an alternator

The ASVAB is the Armed Services Vocational Aptitude Battery, so it contains also items that would not show up in a typical IQ test. I’ll call the second factor the T factor.

We correlated the averaged g loadings of each race/ethnicity pair with the magnitudes of white-black, black-Hispanic, and white-Hispanic gaps on each ASVAB test. All the Pearson’s r and Spearman’s rho analyses showed small to moderate positive correlations, none of which were statistically significant at conventional levels (significance testing is based on Spearman’s rho in these analyses, see Nyborg & Jensen 2000 for details). For example, here’s the scatter plot from the black-white analysis:

Image

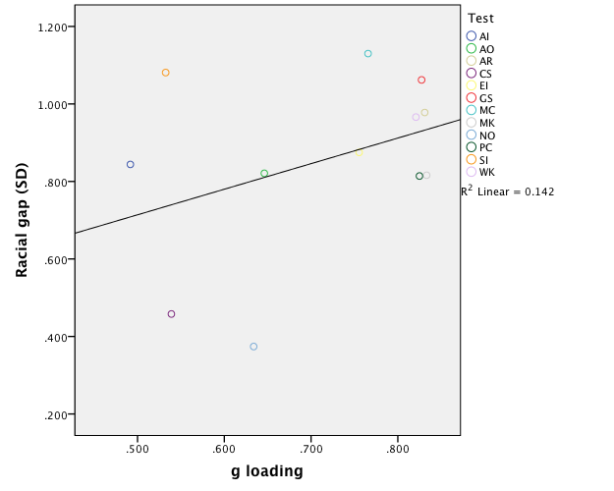
Pearson’s r’s for white-black, black-Hispanic, and Hispanic-white comparisons were 0.38, 0.12, and 0.39, respectively, while the corresponding Spearman correlations were 0.14 (ns), 0.077 (ns), and 0.287 (ns).

However, it could be that the expected correlations aren’t there because of confounding due to different reliabilities of the tests. However, controlling for reliabilities doesn’t substantially change the results (not shown here).

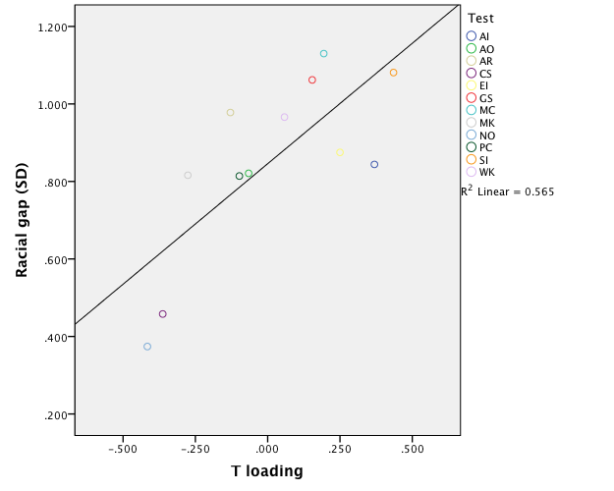
Therefore, the MCV does not support the hypothesis that g is driving the racial/ethnic differences in the ASVAB tests. So what then explains the fact that gaps differ across tests? I correlated the loadings of the second factor, the T factor, with differences in test means between whites, blacks, and Hispanics. Surprisingly, the T factor is strongly (r=0.75, rho=0.72) and highly significantly (p<0.01) correlated with the magnitudes of the gaps in the black-white analysis. The results hold even when partialling out reliabilities. The scatter plot looks like this:

Image

In the black-Hispanic and Hispanic-white analyses the results are broadly similar, although the correlations are somewhat smaller and not always significant. Thus the racial/ethnic gaps are not only not explained by differences in g loadings, but are in fact explained by loadings on the T factor which is uncorrelated with g! Does this mean that T and not g is the main source of racial/ethnic differences in ASVAB abilities? In fact, it does not indicate that, and these analyses only demonstrate the shortcomings of the MCV.

One way of studying how different factors contribute to differences between the mean scores of races/ethnicities is to do a point biserial correlation between each racial/ethnic dichotomy and scores on each test and partial out factor scores on either factor. Here’s the results from the black-white analysis (all the results below are significantly different from zero unless otherwise indicated):

Zero-order g partialled out T partialled out
GS 0.358 0.052 0.337
AR 0.339 .003 ns 0.377
WK 0.321 .002 ns 0.322
PC 0.284 -0.083 0.317
NO 0.130 -0.143 0.261
CS 0.170 -0.060 0.275
AI 0.295 0.111 0.217
SI 0.368 0.188 0.317
MK 0.279 -0.067 0.357
MC 0.378 0.111 0.350
EI 0.289 -.006 ns 0.249
AO 0.297 0.034 0.315

As can be seen, partialling out g scores removes most of the gaps in all tests, while partialling out T scores has only a small effect. Thus g is the main source of cognitive differences between blacks and whites, while T is a minor source. For some reason, T is nevertheless a major source of differences between the relative sizes of gaps on different tests, which is why the MCV analysis fails.

The results from Hispanic-white analyses are rather similar:

Zero-order g partialled out T partialled out
GS 0.262 0.068 0.238
AR 0.198 -0.054 0.212
WK 0.236 0.036 0.222
PC 0.179 -0.069 0.188
NO 0.139 -0.020 0.207
CS 0.105 -0.045 0.162
AI 0.19 0.068 0.148
SI 0.248 0.106 0.206
MK 0.175 -0.056 0.214
MC 0.211 -0.002 ns 0.181
EI 0.216 0.026 0.179
AO 0.097 -0.101 0.114

Finally, black-Hispanic differences:

Zero-order g partialled out T partialled out
GS 0.102 -0.012 0.122
AR 0.167 0.081 0.224
WK 0.09 -0.032 0.121
PC 0.12 -0.004 ns 0.163
NO -0.028 -0.162 0.075
CS 0.072 -0.027 0.147
AI 0.127 0.060 0.105
SI 0.14 0.117 0.159
MK 0.117 -0.018 0.189
MC 0.208 0.168 0.229
EI 0.073 -0.024 0.100
AO 0.256 0.192 0.272

Overall, these results support the hypothesis that g is the major source of racial/ethnic differences in the ASVAB, particularly between whites and blacks. The analysis also shows that the MCV is a flawed method, which is of course well known. For example, according to Ashton and Lee 2005, “first, associations of a variable with non-g sources of variance can produce a vector correlation of zero even when the variable is strongly associated with g; second, the g-loadings of subtests are highly sensitive to the nature of the other subtests in a battery, and a biased sample of subtests can cause a spurious correlation between the vectors.”

Multi-group confirmatory factor analysis appears to be a much better method for testing Spearman’s hypothesis. At the moment, that method is unfortunately beyond my skills and patience.

In part 2 of this post I’m going to extend this analysis to differences in skin color.

See here for John’s SPSS syntax for combining the ASVAB variables (there are two of them for each test), regressing out the effect of age on ASVAB scores, and performing a factor analysis on the ASVAB.

Fuzzy Wuzzy was a bear….

GC maintains that the Hispanic-White IQ difference fails to converge by the fourth generation. If so, this would be informative as to the etiology of the differential. I articulated why in a previous post. IQ differences between families, within populations are poorly environmentally transmitted across generations. This is because the environmental correlation between parents and offspring is low. The situation is depicted below:

generationxIQgapifSE
Continue reading

Newer posts »

© 2024 Human Varieties

Theme by Anders NorenUp ↑