There are convenient ways researchers can collect IQ scores and correlate the observed scores with measures of self-reported health, socio-economic attainment, personality or political views. In platforms such as Prolific or MTurk, participants make money in their spare time by completing tasks. Designing a test that displays both a high loading on the general factor of intelligence, while avoiding measurement bias and bad quality data from online participants, is quite a challenging task.
(update: July 19th 2024)
CONTENT
- Introduction page content
- Item’s pass rate and g-loading
- Lazy and dishonest test takers
- Short versus long test
- Scrolling dilemma
- Item type “write-in”
- Instruction and rules
- Cultural content and cultural bias
- Computerized Ability Test
The issues related to online testing are illustrated based on the numerous IQ tests Jurij Fedorov devised, with my assistance, using Alchemer’s professional software.
1. Introduction page content
Since IQ research is a sensitive topic, we try not to present our test as a cognitive ability test but instead as a puzzle test when it taps on abstract reasoning or knowledge or quiz test when it taps on verbal ability or math ability.
In any test, we present the task required by the test and illustrate with one extremely easy item. We give the number of items and the time limit. If the items starts easy but increases in difficulty, we make sure they understand it. We ask them to use the time wisely and to the fullest to maximize their score.
To increase motivation, we announce their scores will be displayed at the end of the test and propose to send a PDF with their answers. To reduce cheating, we announce that external help such as searching for word definition in the case of verbal items, or using calculators or writing down the numbers in the case of mental math items, are not allowed.
2. Item’s pass rate and g-loading
A high quality test must display several characteristics. It must be of adequate difficulty, not too high or too low, and must display on average high items’ g-loadings. The former is known as pass rate, i.e. the probability of correct response. The second refers to the correlation of the item with the general (g) factor of intelligence, henceforth, g-loading. The higher the item loads on g, the more it discriminates low and high ability persons.
The test should contain items of various difficulty levels but be adequate overall for the target participants. Short test length coupled with few hard items can easily create censored data (ceiling effect). As a result, some individuals are stacked at a certain threshold value because they cannot attain a higher score and their true ability is hidden, even though tobit regression can help dealing with this issue. The average pass rate should be high enough so that people are still engaged throughout the test. Lack of engagement will cause participants to engage in careless behaviour, ultimately decreasing the quality of the data.
IRT models are used to estimate the loadings, as in Kirkegaard (2021). One condition for estimating an item’s g-loading is variance. If all participants get 0% (score 0) or 100% correct (score 1), there is no variance in the score. If a variable’s value does not vary, it cannot covary. But estimating reliable g-loadings requires either large sample or more balanced pass rates. Let’s say the sample is N=10 and the pass rate is 90%, implying only one person failed, but this person happened to have a high total score and failed the item due to misreading or distraction. This item will not have large, positive g-loading and whatever estimate it gets, it cannot be reliable.
Guessing decreases g-loading because if by chance a lower IQ individual gets the item right, it lowers its relationship with latent cognitive ability. A related problem is the partial (or informed) guessing. If one option out of five looks obviously wrong, then the probability of correct guessing is 25% instead of 20%. Alternatively, one may increase the number of answer options or twist the instruction so that the test taker is asked to select 2 (or 3 words) with similar meaning from a list of 5 words. This reduces the probability of random guessing.
Another threat to g-loading estimates is the time limit. Since the time is usually displayed on screen, participants see how much time is left. If a couple seconds remain and there are several items still unanswered, the participants may decide to accelerate and spend only a few seconds to answer the last items faster (which are likely more difficult than the previous ones). Due to this guessing strategy, the g-loading may not accurately reflect the relationship of this item with latent ability. A solution is randomization of the last set of items. For instance, the last 10 items of a 40-item test are randomized. This allows the negative impact of time constraint to spread out across items. If item randomization is not activated, some good items may appear as bad or broken simply because of time constraint during the last seconds.
A last issue with g-loading is consistency across multiple testing. As we removed items that worked badly in prior testing, e.g., displaying very low pass rates or very low g-loadings, we hoped our revised test would display on average higher g-loadings. Often, it turns out not to be the case. Items which once displayed acceptable (but not high) loading estimates often show extreme volatility, going to zero or negative during the second test run. Among possible causes are sampling error, as we use small samples (N=40/50). Whatever the case, we discard items which are inconsistent and we create and test new ones.
Not all items with low loadings should be removed however. At the start of the test, especially for reasoning tests such as the Raven, items are so easy that if people failed more than one of them, these people are likely not qualified for taking IQ tests. These items serve as markers of attention, useful for detecting bad data quality. Take the following item:
There is no way a failure on this item tells us anything about true intelligence level, therefore low loading is not unexpected. A failure on such an item most likely implies that participants pay little attention.
3. Lazy and dishonest test takers
Since IQ tests require maximum attention, one could check an option that enforces the usage of the desktop while disallowing the usage of mobile and perhaps tablet. Otherwise, imagine the following situation of IQ testing on a phone…

A golden rule is to make your survey engaging. If a test is too repetitive, too difficult to the point of frustration, or too long, the participants will start to engage in lazy or careless responding at some point. They may not even engage in guessing, but simply picking an answer just for the sake of finishing the task and being paid. Careless responding is a threat to validity (Arthur et al., 2021; DeSimone & Harms, 2017; Maniaci & Rogge, 2014) but fortunately one can examine these patterns using methods proposed in the careless package for R such as longstring, intra-individual variability, Mahalanobis distance. The longstring index counts the longest consecutive string of identical responses (e.g., option 1) given by a person and indicates careless response if a person gives the same response consecutively over a long stretch of items. The intra-individual response variability calculates the standard deviation of responses across a set of consecutive item responses and indicates careless response if the individual alternates between responding with, e.g., option 1 and option 2, resulting in lower standard deviation. The Mahalanobis D² is a multivariate approach to outlier analysis where one looks at how many standard deviations a person is away from the mean on a single variable. A person’s careless responding will translate into significant deviation from the mean of the distribution of others’ responses.
Other, simpler strategies involve correlating the total score with total time, or examining the time spent for each item. If there is a positive correlation between score and time, one should inspect the lower score values one by one. If an item that takes time to read both the main text or main picture along with all of the answer options is solved within or less than 5 seconds, there is a good chance the participants engaged in lazy responding, especially if their answer is wrong. Moreover, if the time spent on each item does not vary much despite varying difficulty or increasing difficulty levels, one could interpret this outcome either as bad strategy in time management or careless behaviour depending on other behaviour patterns found.
If participants’ informations about their education attainment or previous IQ scores are available, one could examine whether their low score can predict their education level. If not, these individual cases will appear as outliers, and careless responding now becomes a plausible explanation.
Random guessing could help revealing lazy response. In any item, there might be at least one option that is obviously wrong. Take this item.
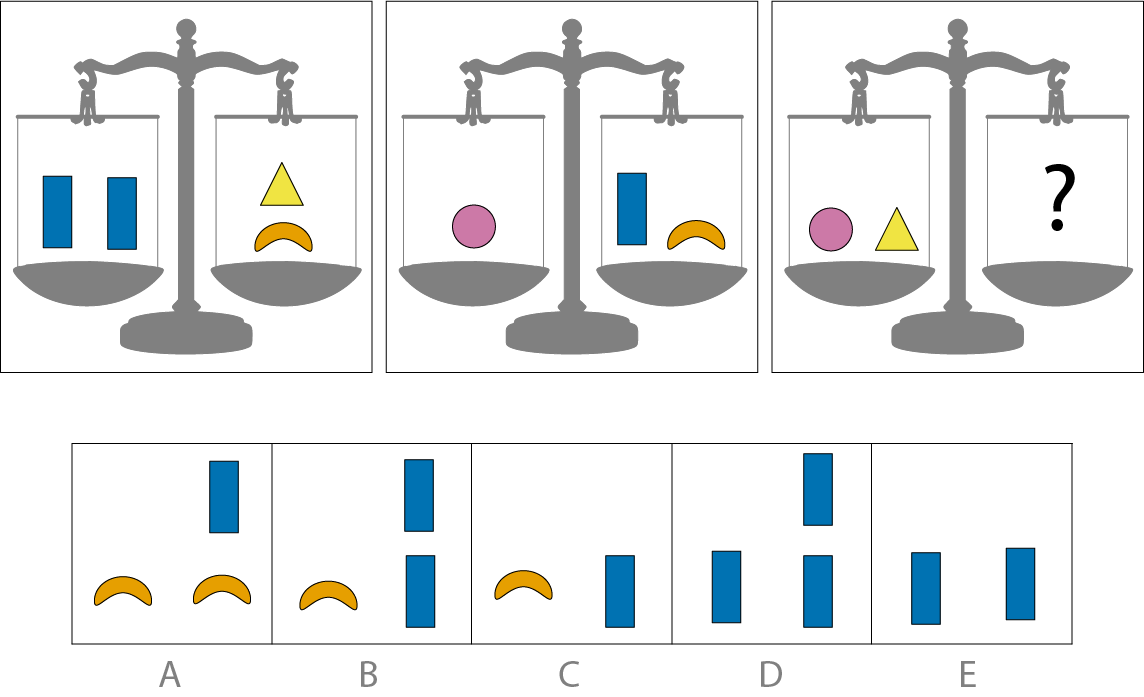
If one reads the second panel, one knows immediately that C cannot be the correct answer. Anyone who picks C has a greater chance to belong to the lazy category. Even honest participants can fail an easy item, but knowing C is wrong, they engaged in informed guessing, rather than random guessing. They didn’t know which answer is correct, and guessed wrong, but they spotted which ones were at least incorrect.
Online participants in Prolific or MTurk are typically paid to complete the test but not to do well. If the participants are told they get rewards based on how well they score, based on multiple thresholds, the price to pay is high, with no safeguard against other misbehaviours. Now people may try to cheat. They might use a calculator, Chat GPT or they might call the brother/sister or wife/husband in the house for help despite our instruction of no external help. Another issue is that certainly some participants were already intrinsically motivated in doing their best because they want to achieve the highest score possible and prove their achievement to themselves; here, the extra reward becomes wasted money.
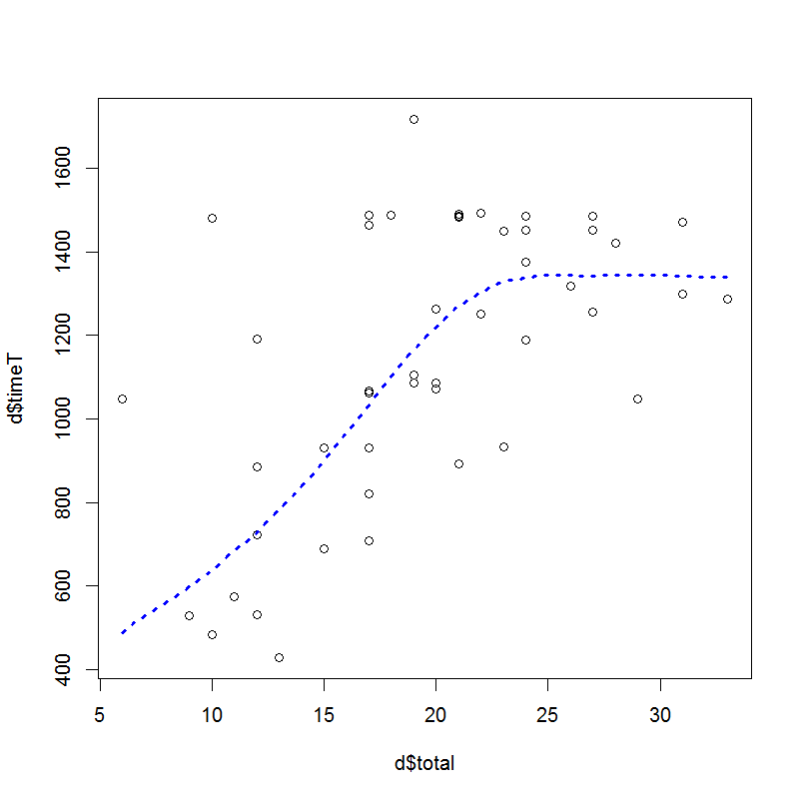
During data collection, a necessary step is the display of a scatterplot of total score versus total time. Any outliers should be carefully examined as well as obvious pattern, such as short time and low score or long time and high score. Ideally, there should be no correlation between time and total score, or else it would suggest careless and/or cheating behaviour. Below is a pattern we found in one of our mixture abstract reasoning test, and it looks like a death spell:
Reducing the prevalence of cheating can be done in several ways. One is to reduce the time limit in such a way that people don’t lose focus because the time spent searching for the correct answer will not make it a viable strategy. A second, more elaborate yet a lot more effective, strategy is to implement a system such as PageFocus, a JavaScript that detects when participants abandon test pages by switching to another window or browser tab (Diedenhofen & Musch, 2016).
During our investigation, we have no evidence yet that the timing of test session alters the quality of the data. But we recently started to target specific times. Ideally, days of rest, such as Sunday and perhaps Saturday when people aren’t stressed or tired after work, but always outside lunch/dinner time and late hours. In all cases we pay attention to the hours of the target country when the test is actually running.
As we repeat our test runs, we accumulate persons providing quality data, which we eventually contact later for another, perhaps harder test. But if people who provided bad data were more likely to have lower IQ, our follow-up studies will not be representative anymore. This is why quality issues must be dealt with seriously at the start.
4. Short versus long test
After trial and error we found that items that require less mental work perform better in Prolific data. The solution is to remove time-consuming items and reduce the time limit in a way that rewards people who solve items fast but keeping the number of unsolved items (due to time constraint) at minimum. Time limit should be reasonable because the test should not be a primary measure of speed factor. Earlier research showed that highly speeded paper-pencil tests correlate less well with the g factor.
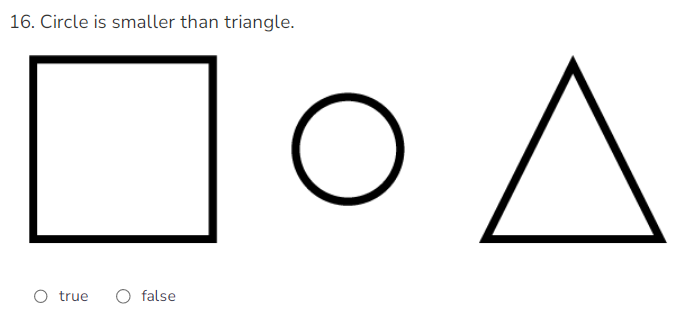
We conducted a test that is inspired by the mini-Q, a 3-minute test which displays correlations of 0.67 and 0.50 with the Intelligence Structure Test and the short version of Berlin Intelligence Structure Test, respectively (Schubert et al., 2024). The original test has a verbal and nonverbal component. The verbal component consists of 64 letter pairs (e.g., “AB”) that are each preceded by a statement about their relation (e.g., “A is not preceded by B.”) that participants have to judge as true or false. The nonverbal component consists of geometric figures (squares, triangles, and circles) next to each other and one further away from the other two that are preceded by a statement about their relation.
We have however increased test length, which varied between 6 and 10 minutes across versions because we were worried of its poor correlation with intelligence due to having a strong speed component, and we have replaced the letter pairs by trivia questions about knowledge because the letter pairs performed badly. It turns out that these new items have higher loadings than figure items. But it may be that our participants could not solve the figure items fast enough as judged by the prevalence of missingness. Trivia items appear easier or faster to solve. Here are several items with high loadings that replicated well across two samples:
65) The bladder is a giant gland that regulates blood sugar levels by producing hormones to signal the liver.
70) White blood cells contain hemoglobin.
74) Nucleus is the outer layer of an atom.
91) Venus is known as the “Red Planet”.
Compare this with the following figure item. It is unclear whether reading the sentence and observing figure both explain why participants were slower.
The advantage of such a short test is the low cost of test run, allowing us to test numerous items all at the same time and see which items’ loadings replicate well. Another advantage is the absence of difference in time spent, which indicates the participants stayed focused until the very end and did not attempt to speedrun the test by giving low-effort response just because they got bored. While the items’ loadings are satisfactory overall, we have yet to study how much this new version changes the correlation with general intelligence test or socio-economic measures.
Generally, shorter time (but not necessarily highly speeded tests) is advantageous for multiple reasons. It reduces the research cost, it reduces extreme variability in time spent, it avoids fatigue effect. We are yet unable to ascertain whether test length affects items’ g-loadings on average because our tests with varying length are also qualitatively different. Our setting for normal tests ranges between 20 and 30 minutes. Long test session is not appropriate for online testing with no direct monitoring.
5. Scrolling dilemma
I use one of our test to illustrate. Jurij has devised a test that is inspired by the Wonderlic Personnel Test. This test is infamous for being hard and it is unlikely one can even finish it, and the difficulty of the last items is insane even for high IQ persons. Our test contains the same item types: arranging words to create a sentence, selecting a word that is an outlier, number series, mental math quiz. Our first, longer version of the test contained 85 items for 20 minutes (i.e., 14.1 seconds per item). The original Wonderlic contains 50 items for 12 minutes (i.e., 14.4 seconds per item) which fit in just 2 pages in a traditional paper-pencil test.
For our test however, on the screen not all items are displayed, only a couple ones, and participants need to scroll down to spot the next items below. Every single second counts and scrolling wastes time. Given the screen size of my PC, I had to scroll a total of 12 times to see the end items. Why is it important? One strategy to get higher score is to be able to detect quickly which items look easier for each participant. A paper-pencil test is convenient, not a computer-administered test. The worst situation is the mobile phone since the items are displayed one at a time. So the test takers never see the next items until they solved the one presented on screen.
6. Item type “write-in”
Another issue pertaining to item type is one that asks the participants to write the correct answer in a box. It removes guessing problems but creates another dilemma for online testing. In our test run of the inspired-Wonderlic test, the correct answer of one logical test was 20 but someone wrote 2o instead of 20. It is obvious the participant knew the answer but he/she mistyped. This is a visible mistake. But a less visible mistake is someone who would type 2 instead of 3. This is similar to a situation when someone misclicked the answer option box next to the correct option box due to being too fast. In a paper-pencil test, these mistakes would not happen. It wouldn’t happen often but to alleviate this issue, the participants should be told in the instruction page that mistypes will be taken as wrong answers.
On the other hand, alternating item types can reveal possible cheating. Imagine two items require mental math, and both are simple. But one is given as a sentence while the other is given as a clusters of numbers with missing element, as illustrated below.
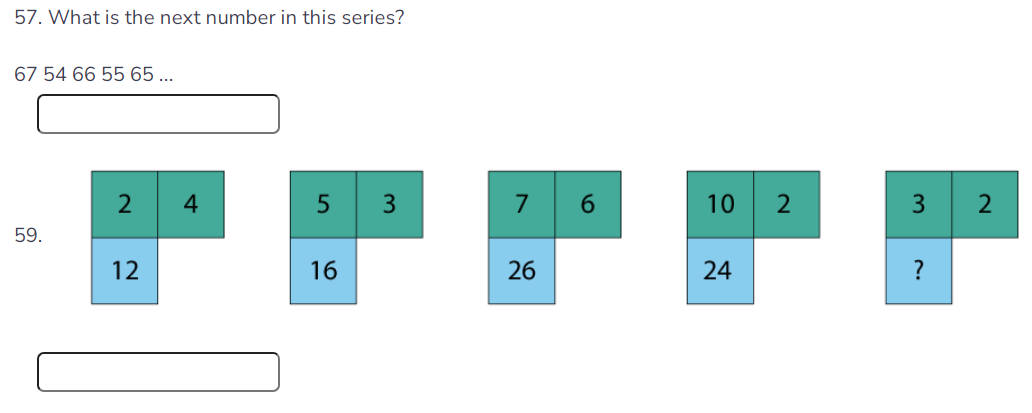
It is easy to cheat the first question type using Chat GPT by copy pasting, but this cannot be done with the second type. If the participants answered correct on items of the first type but wrong on items of the second type despite equivalent difficulty, there is a high chance they cheated.
7. Instruction and rules
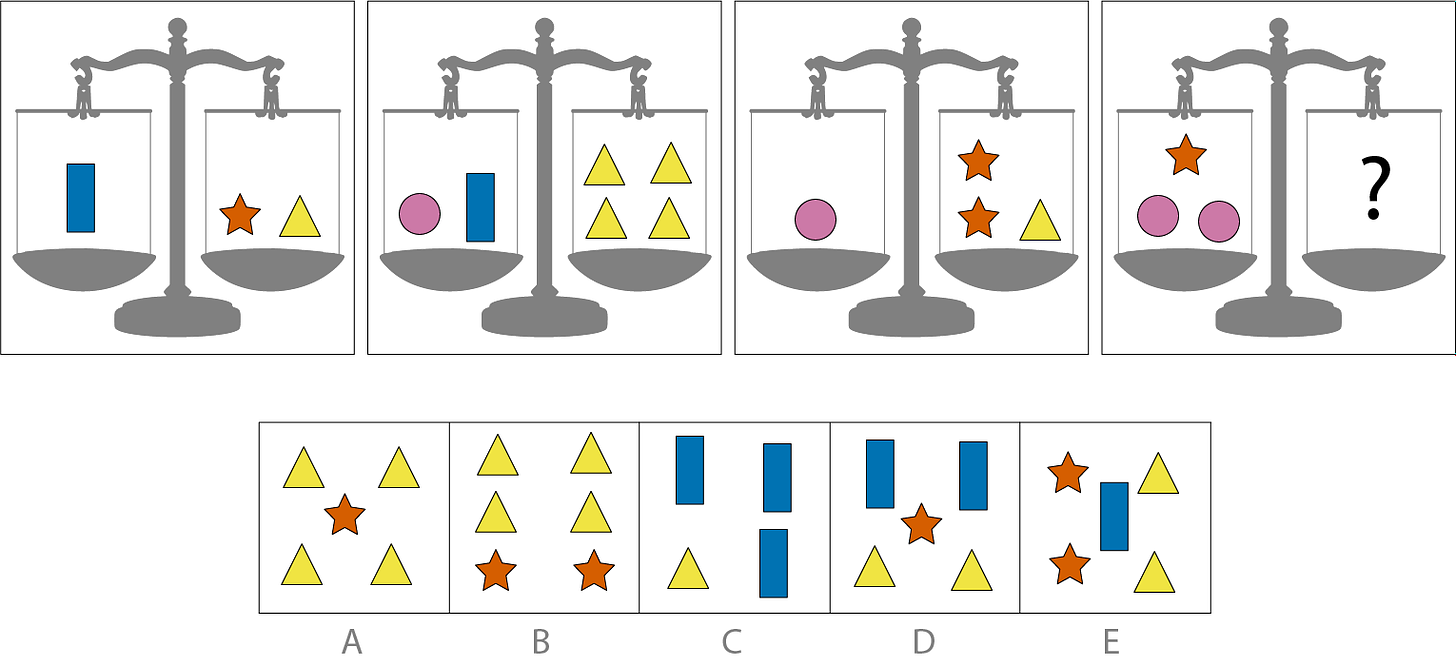
Introduction page should be short and straightforward. The contrary would likely shy away lower IQ participants. While straightforward for vocabulary and mental math tests, instruction becomes more complicated when the test involves novel and/or complex abstract reasoning such as Figure Weights test. An example of a well-built instruction page is shown below:
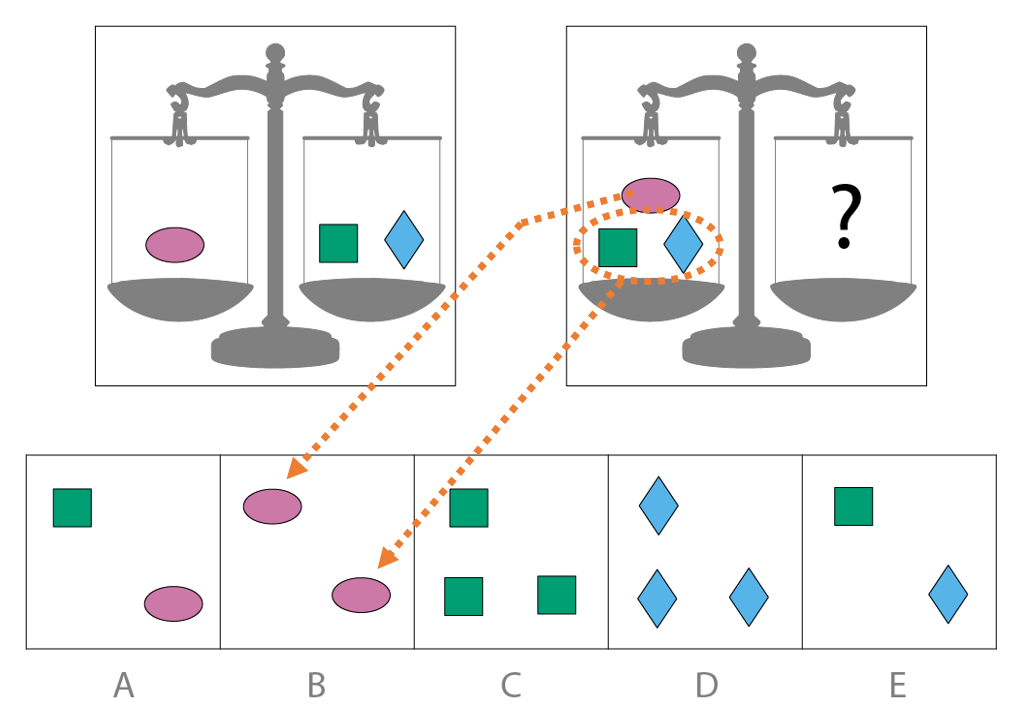
TWO EXAMPLE ITEMS
Below is an example of a puzzle with 5 answer options. In the first box, we see an oval shape that weighs the same as a square and a rhombus.
In the second box, we see an oval, a square, and a rhombus on the same side. The objective is to pick 1 of the 5 answer options that weigh the same as these 3 shapes combined. Answer B is the correct option as it contains 2 ovals. We can conclude it’s the right answer as the first box shows us that a square and rhombus can replace an oval.
In the test itself, each test item consists of 3 to 4 weight scales. Each scale contains items on both the left and right sides, showcasing that each side has the same weight. Use this knowledge to find the correct answer for the missing items on the last scale. You can find the correct answer by recalculating, replacing, moving, and pasting.
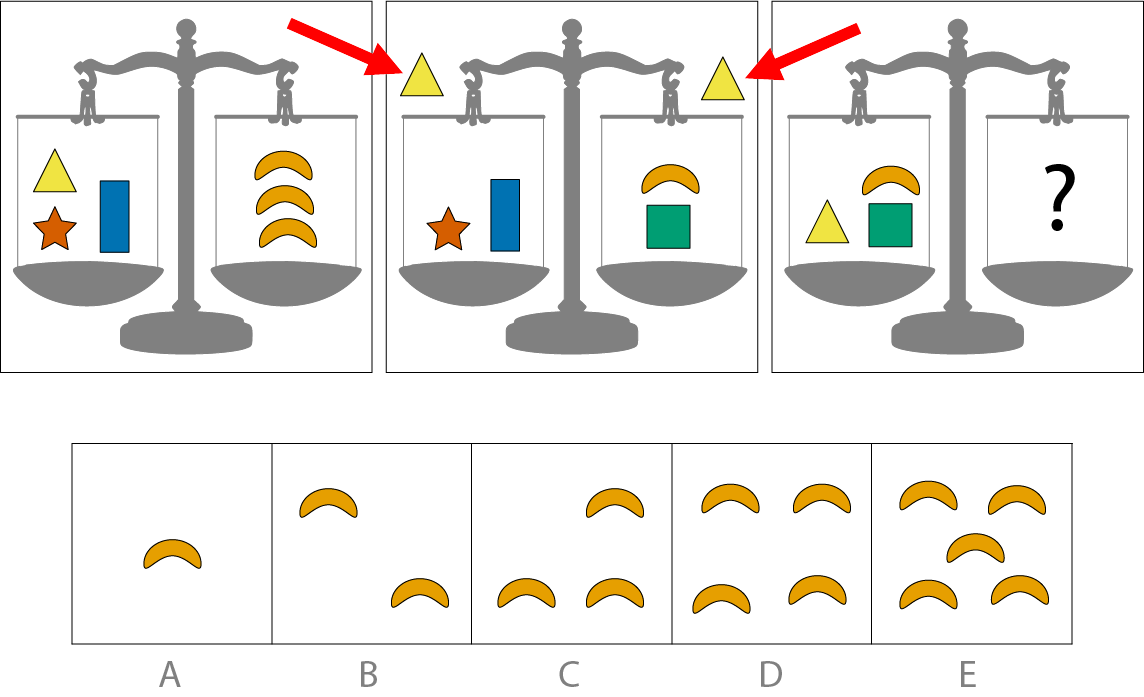
This question is an example of a much harder puzzle. In this example, I added 1 triangle on each side of box 2 to solve it, and here is why: In box 1, we see that a triangle, star, and rectangle combined equals 3 bananas. We also know that if we add the same value to each side of a weight scale, they will balance each other out. By adding a triangle on each side, we see 2 valuable things. The left side is now equal 3 bananas as seen in box 1. While the right side in box 2 is now the same as the left side in box 3. Ergo the shapes in box 3 equal 3 bananas.
One may wonder whether test takers truly pay attention to the details on the instruction page that is loaded with information and already highlights the complexity of the test. The other dilemma is the possibility that some participants feel intimidated and decide not to take the test and cancel their submission, leaving us with a less representative pool of test takers who likely have higher cognitive ability.
Although the test starts with easy items, it becomes increasingly more difficult. If respondents fail on an easy item or take too much time to find the correct answer despite the obvious answer, one might question whether they truly understand the rules. Take this item for instance. It was given as the last set of our abstract reasoning test composed of mixture items such as Raven matrices, figure patterns and figure weights, without instruction at all.
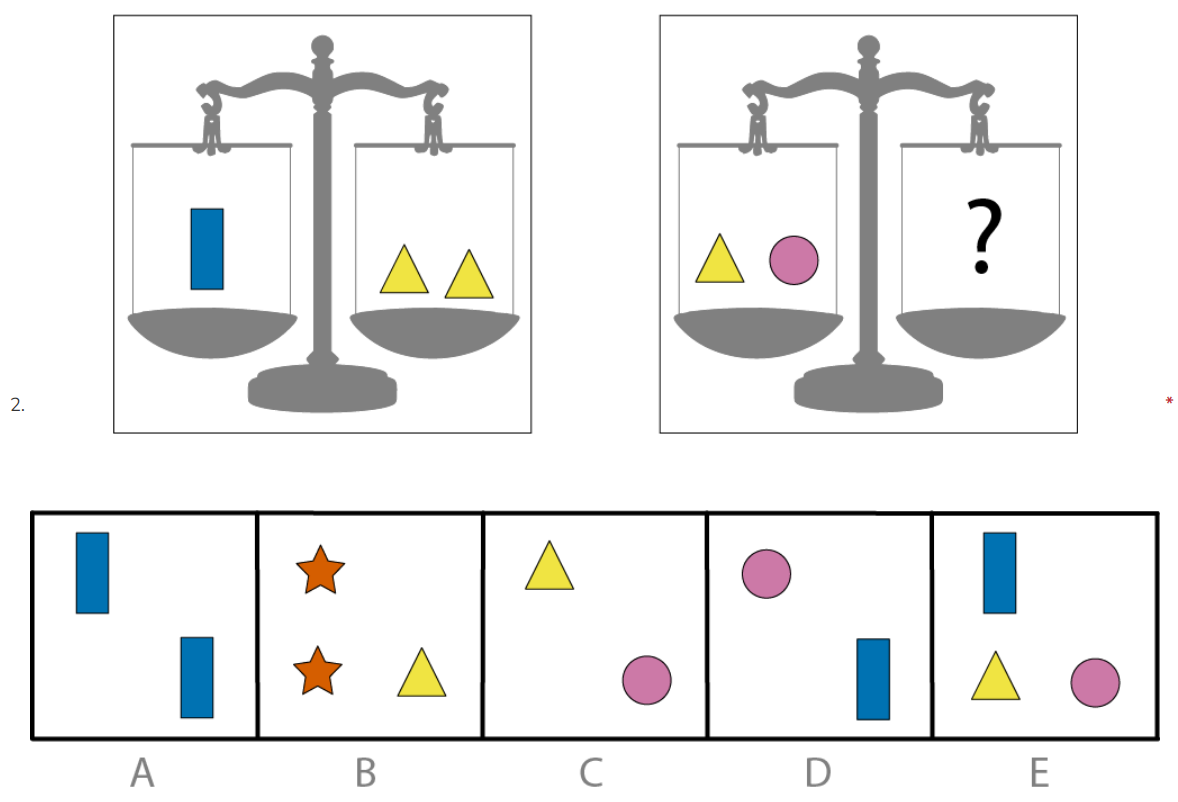
In our small Prolific sample (N=40), only 36% got it correct. Yet the answer should be obvious within 5 seconds even without being told the rule of the game. An incorrect answer is proof of careless response. Another item that quickly follows has a straightforward solution, even without instructions, yet only 29% got it correct. Here it is:
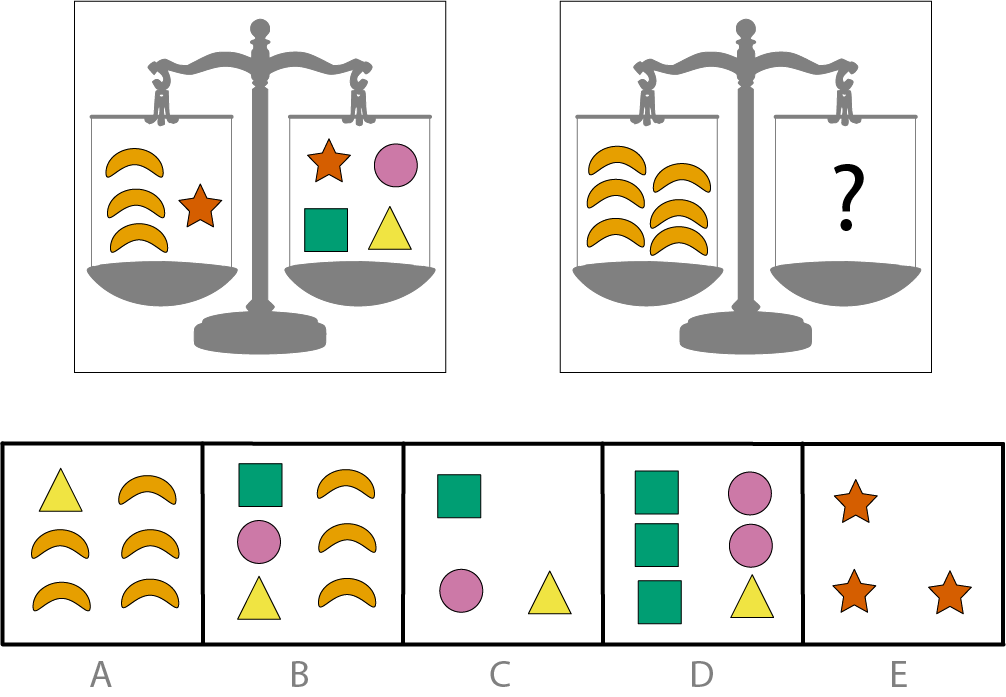
If that item was given in a test providing the earlier introduction page, a failure on this item, which is easier than the examples shown in the introduction, proves that they did not care to read the instruction or they wrongly thought they understood. Either way, one should not trust the data of participants who failed multiple items like this one. The two items illustrated here obviously should be used as markers of attention/motivation rather than intelligence.
Another concerning issue is the time spent per item. From our experience, Prolific users do not spend much time per item. This is why an item that requires one to find words with similar meanings is less likely to yield a positive correlation between time and score, because you either know or don’t know the words. In the latter case, you resort to random guessing. On the other hand, abstract reasoning requires time, especially when you are confronted with a hard item such as this one.
Obviously, since they are not paid for doing their best, they have no incentives to strain their brain and stay on this page for long. An item with such difficulty, if answered within 10 or 15 seconds while there was ample time left before the countdown is the best evidence of low-effort response. The participants tried for a couple seconds, then gave up as they couldn’t figure out immediately. The test is not “fun”. Without intrinsic motivation, quality data is unobtainable.
8. Cultural content and cultural bias
A common misconception about verbal tests, often the target of criticism, is that they must always contain a high degree of cultural content. But as Jensen (1980) noted a long time ago, “verbal analogies based on highly familiar words, but demanding a high level of relation eduction are loaded on gf, whereas analogies based on abstruse or specialized words and terms rarely encountered outside the context of formal education are loaded on gc.” (p. 234). The usage of more familiar words instead of specific words reduces the occurrence of culture bias.
A popular idea is that cultural load is necessarily undesirable and must be reduced to zero. As te Nijenhuis & van der Flier (2003) expressed clearly, cultural loading is unavoidable and even desirable as long as future school and work achievement may have a high cultural loading. Removing such items and/or subtests may adversely affect the predictive validity of the test.
Measurement bias happens only if two groups have different probabilities of correct response on a test item, after being equated on total latent scores. Measurement bias can originate from several sources such as psychological stress (e.g., stereotype threat) or emotional response or cultural bias. In other words, cultural bias is not cultural content but differential exposure to content given equal ability.
Although research using refined techniques showed no evidence of measurement bias with respect to race differences and somewhat with respect to gender differences in IQ, the test constructors should screen for items with potential bias, such as logical questions that rely on knowledge in mechanics, of which women likely fail more often than men even after being equated on general cognitive ability. Content expertise helps avoiding the ipsitivity problem when using Differential Item Functioning (DIF) techniques to detect bias.
It would not be wise to discard knowledge-based content for online testing. We have repeatedly administered both mutiple versions of verbal and nonverbal tests in multiple occasions. From our observation, knowledge based tests seem to be more engaging and produce slightly higher items’ g-loadings compared to abstract reasoning. To illustrate, Jurij devised a quiz test that contains items of general knowledge and requires to pick 3 options that belong together, but that screens out participants who don’t have English selected as first language. The test items behave consistently across two independent samples and the test overall displayed the highest items’ g-loadings so far. Below displays two of our items that show both high pass rate and good g-loading.

Now that non-English speakers were screened out, the remaining threat is knowledge content that is specific to certain cultures or countries. As we made sure this kind of item is not included, item bias should be minimized. DIF techniques will be used to detect bias and exclude these items when calculating latent general ability across groups such as sex and race.
9. Computerized Ability Test
A general improvement of test administration is the promising approach of Computerized Adaptive Testing (Hambleton et al., 1991, ch. 9). Lord during the 1960s began a comprehensive research and concluded that a fixed-test length, as is common in test administration, is inefficient for comparing low and high ability groups. A test provides the most information about true ability when there is a good match between the examinee ability and test difficulty. A test can be shortened without any loss of measurement precision if the items matched the examinee ability. In a CAT, the sequence of items administered depends on the examinee’s performance on earlier items in the test. If participants succeed (fail) on the first items, they are given harder (easier) items. This solves a problem we faced a few times: a test that is overall too easy or too hard.
Zitny et al. (2012) compared the computer-based and computerized adaptive versions of the Test of Intellect Potential (TIP) and the Vienna Matrices Test (VMT) with their paper-pencil version. They showed that both versions compare well with the paper-pencil format, and that the CAT version yields similar validity despite using a small number of items.
Discover more from Human Varieties
Subscribe to get the latest posts sent to your email.


I saw this comment by Kevin Byrd can you respond to it I’ll quote him This is some embarrassing flailing. I document several misrepresentations and inaccuracies in your video. The claims about the cause of the Flynn effect decline and the relationship of g-loaded IQ subtests and culture were just two direct refutations. You seem very confused about the fact 84% of genes are expressed somewhere in the brain at some point during development. This has no implication for racial differences unless you can specifically identify expression differences between races and their relationship to IQ. This research has not and likely cannot be done and the genetic data I presented shows there is no evidence of substantial genetic differences between races for genes associated with intelligence when you correct for biases in GWAS engage with your references the whole time, and bring up studies that address the crucial weaknesses in your cited work. It’s a literature review based on some of the latest genetic studies and on economic papers that correct for the shoddy statistical analyses used in much of the IQ literature. It isn’t the “sociologist’s fallacy” to show that accounting for these socioeconomic differences reduces the gaps since there is strong evidence and historical documentation that these socioeconomic differences between races are not genetic themselves and again no evidence from that genetics contributes to these racial gaps. Bringing up the Coleman report is irrelevant when I present papers from this decade (not half a century ago) showing that data from 4 million students pointing toward economic inequality and segregation as driving the majority of achievement test score gap in schools. You should update your references to the proper century. Now addressing the rest of your tantrum in order: 1. Yes, correlational research is weak and needs either experimental validation or more robust methods to infer causality. 2. They are fundamentally interactions, they are not separable as genetic or environmental and they show that phenotypes can change in different environments. 3. Laughing does not refute my own published researcher showing that genes associated with intelligence do not show the patterns that would be present if natural selection were acting to make Europeans more intelligent than Africans. 4. Your evidence for dysgenics relies on faulty genetic methods prone to false-positives and from researchers with no credibility or expertise. 5. The sibling study on the Flynn is precisely the kind of well-designed study that can distinguish genetic from environmental causes and it unambiguously supports environment and precludes genetic causes. 6. Fst between dog breeds are much larger than between human populations. The paper I cited references 3-5% for human races and 27% for dogs using comparable genetic markers. 7. The distinction between within- and between group heritability is a fundamental aspect of that statistical method. Also the data I presented did show school districts where there are no racial test score gaps, a closing racial test score gap for national standardized tests, and IQ tests which show no racial gap.
I tried to google search this comment, every single portion of it leads to nothing. Aren’t you the one who made this comment instead? I wonder. The fact is… if you are asking me to refute these claims, that means you didn’t do your research well as the evidence abounds. And not just in our own blog.
Now, it’s not even related to my post or anything I’ve said anywhere. So it’s a bit annoying to have to answer this comment here.
It’s not even clear what the comment is referring to (a video, apparently? Which one?) as it does not cite any studies from either the hereditarian side or the environmentalist side. But to answer anwyay… The claim that g-loading and culture are related. First define what is culture. Many critics don’t even get this definition right, as that may surprise you. Second, in this blog here I also showed 10 yrs ago that this evidence is not even robust, and using another variable and method, you get the opposite conclusion. Sure it’s based on weaker methods such as MCV, but so does the original claim of such relationship was based on MCV too. The model on which this claim is based was one assuming a dichotomous verbal vs nonverbal latent ability, the first being defined as cultural and second as noncultural. Years ago, Jensen already explained why this opposing concepts aren’t accurate. The point 5 about Flynn effect occurring within family actually rejects environmental hypotheses that assume between-family influences, e.g., nutrition, education, home environment etc.
Who used the Coleman report nowadays? There are much better evidence, and some studies aren’t necessarily congruent with Coleman anymore, and some hereditarians know this. So you’re basically forcing open doors. And that segregation is the cause of the racial group difference requires causality evidence, there is none. Actually it’s not even residential segregation that is related to test scores, especially after controlling for exposure to poverty within school. How do I know? I’ll let you do your own research. But the fact that the black-white gap increases with education level refutes these arguments altogether.
“It isn’t the “sociologist’s fallacy” to show that accounting for these socioeconomic differences reduces the gaps”: same as with laughing (again, wondering who are involved in the debate, certainly not me) doesn’t refute Bird’s research, saying that observed gaps are reduced due to environmental factors does not disprove the sociologist fallacy. There are enough evidence, since now 30+ years old showing that environmental variables are under genetic influences. So yes the above claim still is a sociologist fallacy.
I’m generally aware of Bird’s criticism of GWAS, polygenic score usage for race differences studies. But there are new methods that greatly improves the genetic prediction of other, non-european ancestries, which is a point Bird keeps repeating and yet speaks as if these new methods don’t exist at all. He also makes the point again and again that genetic studies are flawed because standard models cannot account for rGE and GxE effects. But these methods do exist, and these effects, often I noticed, are small. So that doesn’t look a convincing argument against the hereditarian hypothesis overall.
The evidence of no racial gaps or closing racial gaps is not true, there are papers out there indicating the contrary, based on representative samples. His data or whatever this is, likely suffers from selection bias.
There are stupid points such as 1 and 4, which are impossible to answer because 1 is a reminder of a well known evidence so it’s once again forcing open doors and 4 doesn’t tell us what are the faulty methods. Same as the claim of “shoddy statistical analyses used in much of the IQ literature”. You can say how many times you want this is a faulty method, without substantiating the argument, that is plain lazy or stupid.
Hello Meng! Great and very detailed post about test construction as always. I’m surprised you took the time to respond to the above comment. For context, that’s one of Kevin’s comments under a YouTube video someone made about his criticisms of ‘Race Realism’, and they had a back and forth. The YouTuber whose video inclined Bird to respond in the comments is called “ubersoy2000” with the channel’s display tag saying “UBERSOY” (in case you want to go find the video).
Anyway, since your response to that person basically summarized why Bird’s arguments there are silly or lies, I want to take the chance to ask two questions of my own, if you don’t mind answering.
1) What are these better methods for non-Europeans wrt PGS? I haven’t seen you guys write about them here, maybe I’ve missed it
2) I know it has been done on a smaller level elsewhere (again maybe I’ve missed any posts about it here), but are you planning on working on any articles discussing methods used to derive h^2 other than twin studies, like Young’s RDR? If not are you open to it?
Thanks in advance.
Yes I am now aware of such a video, because I recently (and accidentally) came across this post here: https://medium.com/@Idek/rose-wrists-video-on-ubersoy-ft-kevin-bird-90d8ff2f7965
I haven’t watched the video: lack of interest and because it’s Bird, which is quite a toxic personality. Furthermore, I’m already aware of his arguments. I think he summarized it best in this recent article “Confronting Scientific Racism in Psychology: Lessons from Evolutionary Biology and Genetics”. Of course, I know that Chuck is working on a reply (though he has tons of other projects meanwhile) and Piffer already wrote a article before (I don’t think it has been published yet) and there’s yet another person who wrote a piece against Bird (not sure if I’m allowed to say it yet).
I’m personally more involved in psychometrics and statistical stuff, and it takes so much time (especially troubleshooting statistical errors). Unless someone really needs help for the write up or analyses, I guess I don’t have to get involved. Again it might change if they ask or need help.
1) Regarding methods that improve predictive accuracy for non-European ancestry, there are some recent methods, but we have yet to use them:
Hu, S., Ferreira, L. A., Shi, S., Hellenthal, G., Marchini, J., Lawson, D. J., & Myers, S. R. (2023). Leveraging fine-scale population structure reveals conservation in genetic effect sizes between human populations across a range of human phenotypes. bioRxiv, 2023-08.
Liao, K., & Zöllner, S. (2024). A Stacking Framework for Polygenic Risk Prediction in Admixed Individuals. medRxiv.
Sun, Q., Rowland, B. T., Chen, J., Mikhaylova, A. V., Avery, C., Peters, U., … & Li, Y. (2024). Improving polygenic risk prediction in admixed populations by explicitly modeling ancestral-differential effects via GAUDI. Nature Communications, 15(1), 1016.
Xu, L., Zhou, G., Jiang, W., Guan, L., & Zhao, H. (2023). Leveraging genetic correlations and multiple populations to improve genetic risk prediction for non-European populations. bioRxiv.
2) Yes there will certainly be more h^2 studies but not sure yet which methods will be used. But one thing I can say about the supposedly biased estimates and non comparability of those estimates across populations, I’m sure you know that there is a strong theoretical basis for lower IQ group to have lower h^2. Yet in Pesta’s meta-analysis “Racial and ethnic group differences in the heritability of intelligence: A systematic review and meta-analysis” there is no big difference in heritability, meaning that GxE and rGE, if those effects exists and are meaningful, it doesn’t show up at all across groups.
However I suggest you might want to ask Chuck instead (maybe here instead) because he might be the one who is the most involved in this stuff recently.
I was more curious about differences in h^2 between methods rather than populations, but I will message Chuck just like you said. Thanks for the suggestions, citations and clarification. Keep up the informative work!