Emil and I set out to determine if regional variation in racial ancestry could (statistically) explain regional variation in cognitive ability. To keep things simple, we have limited focus to the Americas, which contain primarily trihybrid populations and for which there is a decent amount of admixture data. The results so far align with predictions. Both across nations and across regions within the U.S., Brazil, and Mexico, European ancestry positively correlates with regional-level cognitive ability. In contrast, both African and Amerindian ancestry negatively so correlates. The broader importance of the project is that it involves the construction of an expansive data set which allows for the statistical controlling of continental lineage and associated factors (genes + deep culture), ones which presently confound many analyses. This data set will hopefully allow one to uncover regional and national level factors which are not tangled with ancestry. They must exist. For example, we find that regional levels of European ancestry are associated with better outcomes in both the U.S. and Brazil but also that there is a substantial between nation effect that can not be explained by factors correlated with continental ancestry.
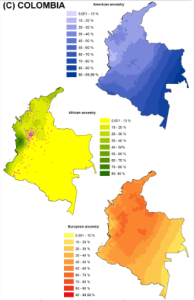
Here, I will discuss a new analysis involving Colombia. Colombia is marked by extensive spatial variation in  ancestry. The admixture map on the left copied from Ruiz-Linares et al. (2014) and the ethnic map on the right taken from Rodriguez-Palau et al. (2007) roughly capture the lay of the land. African admixture is concentrated along the Pacific and Caribbean coast, European admixture is highest in the north and central interior region, and Amerindian admixture is concentrated in the east and south. This ancestral variation allows for a test of our general model.
I computed the variables as follows:
Admixture : Estimating regional admixture for Colombia’s 32 departments plus the capital was not without difficulty since existent studies provide admixture data for only half of the departments. Problematically, specific estimates for the eastern and southeastern departments, which are reported to have high Amerindian components were not available. Nonetheless, we were able to construct three sets of admixture estimates. First, 18 departmental + capital estimates were taken from Salzano and Sans’ (2014) compilation. The ancestry ratios from Salzano and Sans’ (2014) two main sources correlated at 0.9, so we felt that using the combined estimates was justified. Second, missing values were filled in based on regional values and based on Ruiz-Linares et al.’s (2014) and Rodriguez-Palau et al.’s (2007) maps. For example, estimates for Caribbean-Pacific departments were averaged and used to fill in missing data for other departments in this region. In context to the U.S., this would be akin to filling in South Carolina values using the average of the Deep South ones. Third, admixture was estimated using ethnic identity data from the 2005 census in conjunction with average ethnoracial admixture percents as reported in all available studies. The ethnoracial admixture percents came out to as follows:
The computation methods are detailed more precisely in the excel file.
Cognitive ability: For cognitive scores, the Colombian national SABER exam scores were used. The average of the 2003 and 2005 grades 5 and 8 math and reading regional scores strongly correlated with the average of the 2012 and 2014 scores (about 0.85). The scores were on different metrics, moreover standard deviations were not available for the 2003 and 2005 scores (given the source used), so, in the end, the 2012 and 2014 average scores were employed.
Other variables: 2010 HDI scores were taken from Machado (2011). Ethnic identity percents were taken from the 2005 census. Population was taken from the census via Wikipedia.
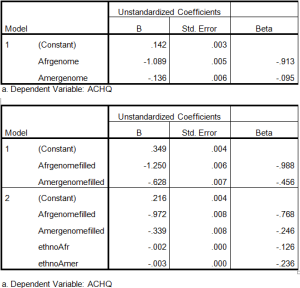
Results: I uploaded the excel file to facilitate future investigations. For the analyses reported below, in line with the general methods adopted for the meta-project, I excluded the capital and weighted by SQRT(population). Salzano and Sans’ (2014) admixture data showed only a weak negative correlation for Amerindian ancestry; this was because, as noted, data was missing for the most Amerindian parts of the country. When data was filled in, the association became significantly negative as predicted. It seems that the negative results are driven by the low scores in 5 districts (Amazonas, La Guajira, Guainía, Vaupés, and Vichada) all of which have high percents of self identifying indigenous and large reservations.
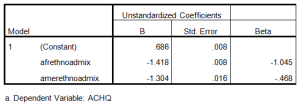
The results immediately above were replicated using the ethnic-admixture data.
Generally, European ancestry was non-trivially associated with cognitive ability (shown below) and with HDI (not shown). These results held regardless of which admixture variable was employed; they were largely driven by the strong negative association between regional outcomes and African ancestry. It is interesting that regional Amerindian ancestry was not associated with regional ability in the case of Salzan o and Sans’ (2014) admixture estimates. While on the national level, Amerindian ancestry negatively correlated with ability, as areas which were heavily populated by self-identifying Indigenous individuals did poorly, one might expect a more constant effect, one that would show up in Salzano and Sans’ (2014) restricted data set, which included only interior and coastal departments. The lack of association might have been due to the unreliability of the data, the specific samples analyzed, or the specific sampling of interior and coastal departments. Possibly, Amerindian ancestry is not negatively correlated with regional outcomes outside of largely indigenous regions. A determination of the matter will have to wait for the publication of more Colombian regional admixture data.
Discover more from Human Varieties
Subscribe to get the latest posts sent to your email.


“Possibly, Amerindian ancestry is not negatively correlated with regional outcomes outside of largely indigenous regions.”
I noticed a similar pattern in your regional analysis of Mexico. In particular, I’m referring to this graph, which compares regional PISA scores with Amerindian admixture levels:
https://humanvarietiesdotorg.files.wordpress.com/2014/10/ameradmixpisa.png?w=395&h=350
To my eyes, the correlation seems mostly driven by the four worst scoring states: Chiapas, Oaxaca, Guerrero, and Tabasco. But these are also states in which you’ll find very large populations of pure-blooded or near pure-blooded Amerindians, many of which admittedly live in poor conditions and in rural areas. They’re the Mexican equivalents of Colombian districts such as Amazonas, La Guajira, Guainía, Vaupés, and Vichada. They’re all also located in the southernmost parts of Mexico:
http://www.mapsofworld.com/mexico/maps/mexico-political-map.jpg
I’d have to double-check, but I think Chiapas and Guerrero have higher amounts of sub-Saharan African admixture than most other Mexican states as well.
In any case, if you remove those four states from the Mexican regional PISA graph, the correlation between scores and Amerindian admixture looks much much weaker. You have states which are only 35-40% Amerindian (such as Sonora and Sinaloa) scoring in the same range as states which are around 70% Amerindian (such as Puebla, Quintana Roo, and Morelos).
Jeffrey,
Thanks for the thoughtful comments. Yes, I am uncertain about a spatial Amergenome x outcome association. When it is found it is not robust, unlike the Afrgenome one. As for Mexico, I uploaded a condensed data file.
When I toss in a variable for the four low scoring states, the association indeed drops. I’m not sure that this is the best approach, though. An alternative would be to control for % indigenous speakers; when doing so the association again drops but not as severely. Another way to investigate this is to split the file by percent Amer ancestry. When you do so, what you find is that among the 17 most Amer states (Amer admix > 0.58, range: 69% to 84%); there is a strong negative association (beta: -0.692), but among the 15 least Amer states (Amer admix < 0.58, range: 46% to 55%), there is a weak POSITIVE association (beta: 0.12). Of course, these 15 states have average scores higher than the 17 more Amer states, so the overall association remains negative. Interestingly, % indigenous has the same negative relation in both sets of states (beta -0.4 to -0.5). Also, for HDI (human development index) Amer ancestry is negative associated about equally in both sets. Generally, there is a lot of noise in the data, so I am not sure how informative these sub-analyses are. I would say that, with respect to Amer ancestry, given the data used, the Mexican results are more robust than the Colombian ones — but both raise important questions. Until better admixture data is available — or at least compiled — for each country, it's probably best to look at the relation in other countries for which there is passable data. Do you have any suggestions? By the way, you are welcome to write up a re-analysis and post it on this blog, if you wish. Perhaps you can find better data.
To note, this recent study suggested that those low scoring states do not have as high Amer ancestry as my data set indicates. As their Figure_S4.docx shows they seemed to have passable coverage for the region. But the results are at odds with those of other studies and are odd since the map seems to give European Yucatan peninsula admixture rates at northern Mexican levels, despite the former areas having relatively high % indigenous. Anyways, it might be best to try to collect better admixture data before trying to determine the cause of various apparent associations.
Chuck,
have there been real increases in intelligence throughout the 20th century, as there have been real increases in height? does the Flynn effect involve increases in essential reasoning ability?
If the present black IQ is the same as the white IQ in the 1950’s, does that mean black people are now as intelligent as 1950’s whites?
I ask because Robert Lindsay thinks people have actually got more intelligent and he says that Flynn thinks so too and its not something to do with test taking.
thanks
For Flynn’s most recent position refer to Flynn et al. (2014) “The g beyond Spearman’s g: Flynn’s paradoxes resolved using four exploratory meta-analyses“:
In the 80s Flynn was arguing that IQ tests didn’t well measure intelligence either between individuals or between generations. By 2000 he was arguing that generational differences were comparable to inter-individual ones.
As for the U.S. BW differences, psychometrically these resemble inter-individual ones and are unlike inter-generational ones.
Chuck, I read some of the paper and it makes sense. As I understand it: The between individual IQ differences measure something fundamental like who has got the best brain; the between generations IQ differences measure cognitive performance due to environment. Kind of a hardware vs software thing. 1900 man with better brain might perform worse on an IQ test than 2015 man with a worse brain but better training and environment.
So thanks for clarifying Flynn’s position. Is this also your position? Has Flynn come around to now seeing it correctly?
I suppose one thing that occurs to me is if people are performing better now, aren’t they effectively more intelligent? They have more usable intelligence. Like the plant that has inferior genes for height but is actually taller.
Secondly, since blacks today perform as well as whites in the 1950’s, shouldn’t they be able to accomplish just as much (which lets face it, was a lot)?
Hmmm…it might just be easier to conceptualize the matter in terms of the structure of intelligence, with its three ability stratums. The higher you go up the more physiologically grounded the abilities are — and, thus, (on average) the differences. Now to this we have to add one other component — test scores. Test score differences need not be due to cognitive ability ones at all.
With this model in mind, we can say: inter-individual differences in full scale IQ scores, for the most part, index differences in latent g — and thus brain efficiency. Of course, this is not always the case; and this was one of the points of the paper cited; many even biologically caused differences are not primarily in g — which reflects very general physiological differences. This noted: much of the inter-generational differences are in narrow/broad abilities. And some of these have nothing to do with cognitive ability at all — for example, in part, they are just due to test taking strategies such as how cohorts handle guessing.
Flynn downplays the latter aspect — to upplay the importance of the Flynn effect; but he is probably right that secular scores differences index socially important cognitive ones. Now, from what I have read/seen, international differences resemble a mix of secular ones (largely narrow/broad ability differences + psychometric bias) and intra-individual ones (largely general intelligence differences). Imaginable there are some g-differences, this leads to differences in how societies function — e.g., how they build schooling and health systems, and this leads to larger overall cognitive functioning differences.
The Black-White difference in the U.S. definitely resembles inter-individual g differences. Imaginably African Americans today function better than European Americans of a prior cohort in various narrow/broad abilities. Does this mean that they can do a lot more? — Yes, but restricted to those abilities.
Hope that helps.
…although, on reflection, perhaps the hardware vs software analogy is limited since in this case the environmental input must alter the hardware.
…because once you are an adult, you can’t add new software and improve your IQ score.
Yes that totally helps, thanks!
Have you seen this?
http://www.sciencedirect.com/science/article/pii/S0160289608000998
Doesn’t this suggest that better nutrition has made brains bigger or better, rather than increases being due to a better educational environment?….but why would the gains be in specific areas and not across the board (ie in g)?