Hu (2013, September, 5; 2013, July, 5; 2013, August, 18) has raised some interesting points. I will comment on a few of them here and present several new analyses.
Cultural Loading, Heritability, and the BW gap
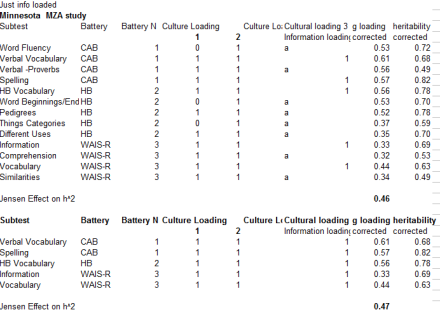
As Meng Hu noted, Kan et al. (2011) showed that subtest cultural-loadings, as they estimated them, correlated both with the magnitude of the B/W subtest gaps and with subtest heritability estimates. The authors interpreted these associations as support for a GxE hypothesis of individual differences and offered a model similar to that proposed by Flynn and Dickens (2001). Moreover, Kan et al. (2011) saw the associations between cultural-load and heritability and between cultural-load and the magnitude of the BW gap as problematic for what they termed a biological g model. Below, I will show that g-loadings fully mediate the association between cultural loadings and the two other variables noted and therefore that what is in need of explanation is only the association between cultural-loadings and g-loadings. I will then proceed to offer an account for this.
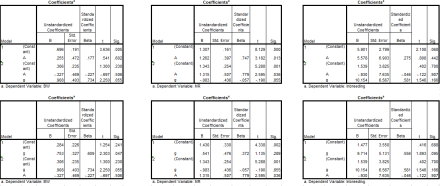
First, I looked to see if g-loadings mediated the association between the BW gap and cultural loadings. They did. Then I looked to see if cultural-loadings mediated the association between the BW gap and g-loadings. They did not fully. The results are shown below. As reliability estimates were not presented for all subtests, I ran the analysis with and without reliability corrections.
Analysis A1: BW, g, cultural-load versus BW, cultural load, and g-load
To investigate further, I simply looked at the association between the BW subtest gaps and g-loadings for only those subtests which were said to be culturally loaded. The r (g x BW) was nearly the same for this subsample as for the full sample. The results are shown below:
Analysis A2: BW and g for Cultural loaded tests
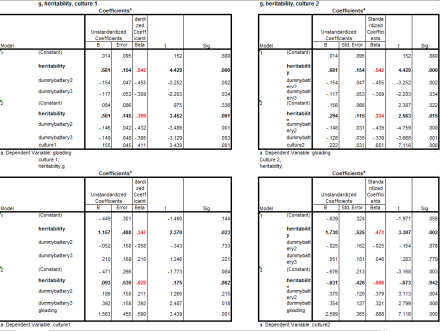
Finally, I repeated the analysis (with a different data set from that used above) using heritability estimates, cultural loadings, and g-loadings. For a more precise estimate, I controlled for the effect of differing test batteries. It was found again that g-loadings mediated the association.
Analysis A3: Heritability, g, cultural-load versus Heritability, cultural load, and g-load
Analysis A4: Heritability and g for Cultural loaded tests
Discussion: The correlations between cultural-loadings and the BW gaps and between cultural-loadings and heritability estimates were both fully mediated by g-loadings. This implies that g is a mediating factor in both instances. What one needs to explain, then, is why more culturally-loaded tests are better measures of g. Unlike Kan et al. (2011), I don’t find this association to be puzzling from a “biological g” perspective. As Jensen (1998) noted, IQ test are indirect measures of cognitive ability. He offered the analogy of measuring individual height by measuring the height of shadows cast on a wall. In the case of IQ, latent ability is measured in terms of information learned. When individuals have a relatively equal opportunity to acquire information, the amount of information learned indexes both the ability to process information and the ability to integrate it. More cultural loaded tests tend to measure a broader range of information relative to less cultural loaded tests and so can better index the ability to integrate information.
Kan et al. (2011) argued that the high correlation between cultural-loadings and g-loadings made implausible an investment theory of intelligence, a theory which he associated with a biological g theory. By investment theory, cognitive ability primarily corresponds to one’s ability to process information, an ability which is best indexed by measures of fluid intelligence; this theory holds that individuals invest their fluid intelligence to develop crystal intelligence. Insofar as g-loadings index g and insofar as fluid ability is said to be a more direct measure of g, Kan et al. (2011) reasoned that g-loadings should be more correlated with the less culturally loaded fluid ability than with the more culturally loaded crystal ability. They then saw this as a problem for an investment theory and by way of which for “Biological g” theory. However, this argument makes sense only so long as one identifies investment theory with biological g theory. As it is, investment theory is based on the Gc-Gf model of intelligence and it’s not clear that this model best characterizes the structure of intelligence (for discussion see: Major et al., 2012).
More generally, Kan et al.’s proposed model is problematic. By this model: (1a) g and variance in it, results, to a large extent, from people selecting their own cognitive niches, (1b) which results in a correlation between subtest g-loadings and the degree to which subtests tap into information that individuals are heterogeneous in their exposure to. The correlation between g-loadings and cultural-loadings, in turn, arises because (1c) “heterogeneous exposure”-loadings correlate with cultural-loading. That is, more culturally loaded tests tend to require more of the type of information that a population is not homogenous in its exposure to. Finally, there is a correlation between cultural-loadings and heritability-loadings because (1d) people follow their genetic dispositions to select their cognitive niches. For comparison, by a “biological g-model”, (2a) g and variance in it result, to a large extent, from additive genetic effects, (2b) which results in a correlation between subtest g-loadings and heritability-loadings. The correlation between g-loadings and cultural-loadings, in turn, arises because (2c) cultural-loadings correlate with the broadness of a measure of g and (2d) cultural-loaded tests tend to be broader measures of g because they can tap into the general ability to make sense of the world and of ideas. The model of Kan et al. predicts that “heterogeneous exposure” loadings, per se, should correlated with g-loadings. If so, group differences resulting from differential exposure to information should be g-loaded. Yet there is a large body of research showing otherwise. For example, differences due to test training and test retaking are negatively correlated with g (Nijenhuis, 2007). The mentioned differences are clearly due to differences in exposure to information and yet they are not positively associated with g-loadings. Whatever the case, the inference of Kan et al. is very weak since they are inferring an association between g-loadings and heterogeneous exposure-loadings from an association between g-loadings and cultural-loading. It’s not difficult to imagine situations in which a subtest has both high cultural-loadings and low heterogeneous exposure -loadings. This situation results from a common exposure to information as a result of the homogenizing effects of the mass media and of public education.
As for the association between cultural-loadings and the magnitude of the BW gaps, it should be pointed out that others, when operationalizing cultural-load differently, come to the opposite conclusion as Kan et al. did. For example, according to Jensen and McGurk (1987):
McGurk collected a representative sample of 226 test items from various well-known group-administered IQ tests that were widely used at the time, such as the Otis Test, Thorndike CAVD, and the American Council on Education Test. A panel of 78 judges, including professors of psychology and sociology, educators, professional workers in counseling and guidance, and graduate students in these fields, were asked to classify each of the 226 test items into one of three categories: I, least cultural; II, neutral; III, most cultural. Each rater was permitted to ascribe his own meaning to the word ‘cultural’ in classifying the items. McGurk wanted to select the test items regarded as the most and the least ‘cultural’ in terms of some implicit consensus as to the meaning of this term among psychologists, sociologists, and educators. Only those items were used on which at least 50% of the judges made the same classification or on which the frequency of classification showed significantly greater than chance agreement. The main part of the study then consisted of comparing blacks and whites on the 103 items claimed as the ‘most cultural’ and the 81 items claimed as the ‘least cultural’ according to the ratings described. The 184 items were administered to 90 high school seniors. From these data, items classed as ‘most cultural’ were matched for difficulty (i.e. percentage passing) with items classed as ‘least cultural’; there were 37 pairs of items matched ( f 2%) for difficulty…
…The results flatly contradicted the hypothesis that the white-black difference in test scores is due to the cultural loading of the items, at least as the culture loading of test items is commonly judged. On the test composed exclusively of the 37 items classified as ‘most cultural’, the mean white-black difference (expressed in units of the average standard deviation in the two samples) is 0.30a, as compared with the mean difference of 0.58~ on the test composed of the 37 items classified as ‘least cultural’. In a subset of 28 pairs of ‘most’ and ‘least’ cultural items that were matched for difficulty (based on the per cent passing in the combined samples), the mean blackkwhite differences are 0.32~~ and 0.560 on the ‘most’ and ‘least’ cultural tests, respectively. Hence differences in item difficulty are not responsible for the relatively greater black deficit on the ‘least cultural’ items…
…In general, the C items are more dependent on information gained by subjects prior ts taking the test. The NC items, on the other hand, contain all the information required for solution within the item itself, so that achieving the correct answer depends upon properly manipulating the given information of figuring out the solution from the essentially simple and familiar information provided in the item. This distinction between the recall of past-learned information and the mental manipulation of simple and familiar information that is provided in the test item itself is apparently the implicit basis on which McGurk’s judges classified test items as being more or less culturally loaded.
Why Jensen and McGurk (1987) and Kan et al. (2011) came up with opposite results is not clear. The former study was based on results reported in McGurk (1951) while the latter was based on results reported in Jensen (1985). It’s possible that the psychometric nature of the gap changed over time. Probably a more likely scenario is simply that cultural-load was differently operationalized by the different judges who assessed the subtests. Many of the items which were described as “non-cultural” in Jensen and McGurk (1987) — such as verbal analogies, syllogisms, arithmetic problem solving, and verbal opposites — would have been classified as “cultural” by Kan et al. (2011). Whatever the case, the reason is unimportant since the results of Kan et al. (2011) are, nonetheless, interesting in general — because they show that “cultural-loads” operationalized in some manner correlate with g-loadings — but not in particular with respect to the BW gap.
Analysis B. g-load, prediction errors, BW gap
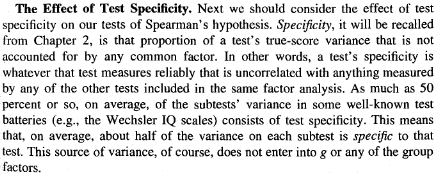
What emerges robustly from the above analysis is that g-loadings mediate the association between cultural-loadings and the magnitudes of the Black-White gaps. I have argued elsewhere that such mediation more strongly evidences g-differences than do bivariate correlations between g-loadings and the magnitude of the subtest differences. Mediation literally puts g at the center of things and makes less plausible arguments that the correlation between group differences and g-loadings are driven by e.g., broad factor differences. That is, they make less plausible the specificity critique of the method of correlated vectors.
It might be helpful to illustrate the above criticism of MCV. Below shows the correlation between the WISC IV deaf /hearing differences and g-loadings. The deaf/hearing differences were taken from Krouse (2012), who found that the D/H differences were measure non-invariant. As seen, this correlation was positive and significant. On further analysis, though, this correlation turned out to be driven by verbal factor differences. The D/H difference was largest on the verbal factor and the verbal factor happened to have a higher g-loading than the non verbal factors. This resulted in a Jensen Effect, which disappeared when one regressed out the effect of factors.
Analysis of Wisc 4 D/H difference: Descriptive statistics

Analysis of Wisc 4 D/H difference: Correlational and regression results
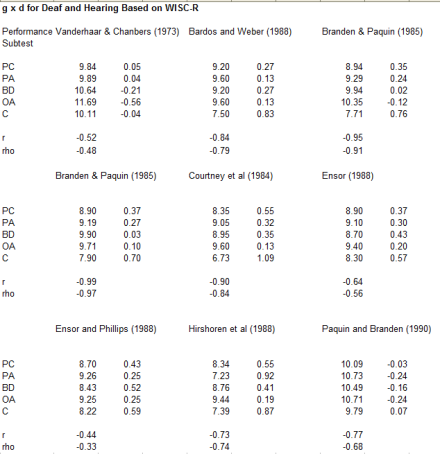
That the Jensen Effect was driven by verbal factor differences was confirmed by an analysis of 9 studies on the H/D performance subtest differences. The values were taken from Braden (1990). All of these analyses showed moderate to strong negative correlations between the magnitude of the group differences and performance test g-loadings. In comparison, for all 6 WISC samples discussed below, the r (g x BW) was highly positive for both performance and verbal subtests. In fact, I was unable to find any mediating non-g factor.
Analysis of 9 Wisc performance D/H difference: MCV results
Whatever the case, specificity is still a potential problem when it comes to correlating vectors. As such, showing that the correlation between the BW gap and a third variables is mediated by g-loadings is not without worth. With this in mind, I looked at the relationship between g-loadings, the BW difference, and job performance error predictions. The relevant variables were taken from McDaniel and Kepes (unpublished). The association between the latter two variables was completely mediated by g-loadings. This is shown below:
Correlation results: BW d on g, job error predictions, g saturation
Regression results: BW d on g, job error predictions, g saturation
Discussion: I take the above as strong evidence for the veracity of Spearman’s hypothesis. Taken together with numerous other lines of evidence, it must be accepted that Spearman’s hypothesis has graduated to the level of scientific theory.
It should be noted that Jensen (1998) addressed the specificity critique. He commented:
In short, while specificity is a problem for MCV, as pointed out by critics, the existence of specific influences can be explored through component analysis. With regards to the B/W gap, this was done, for example, by Jensen (1987), Table 1.
Analysis C. BW gap and heritability
From a hereditarian perspective, Spearman’s theory is important in light of the fact that phenotypic g is largely shaped by genetic g. This then makes a genetic g explanation for group differences plausible. Some hereditarians have argued that more evidence of genetic g differences comes for the supposed correlation between subtest heritabilities and the magnitudes of the subtest group difference. For example, Hocutt and Levin state:
And in fact (although this is not mentioned in BC), it has been found that black-white score differences on IQ subtests correlate positively with score heritability within races: the more heritable an IQ subtest is among whites and among blacks, the wider the black-white difference, whether within-group subtest heritability is determined by standard sibling comparisons or by response to inbreeding depression (Rushton 1989). (Hocutt and Levin, 1999. The Bell Curve Case for Heredity).
While Hereditarians have taken this purported association as evidence of genetic differences, others have argued that the association is tautological e.g., Revelle et al. (2011); Kan et al. (2011). Their argument, simply put, is that since subtest heritability estimates correlate with genetic g-loadings (Deary 2006) and since genetic g-loadings correlate with phenotypic g-loadings (Luo et al., 1994) and since phenotypic g loadings correlate with the magnitudes of the B/W subtest gaps (Jensen, 1985; 1998), the subtest BW gaps should correlate with subtest heritability estimates, regardless of whether or not the B/W difference is conditioned by genes. Of course, this explanation presupposes the veracity of Spearman’s hypothesis (in addition to a particular model of general mental ability) — a presupposition which raises the question of how the g-loaded differences got there in the first place.
For all of the discussion of this association, though, scant evidence of its existence has been presented. As for this, Jensen (1973) and Nichols (1970) found that the BW gap correlated with the magnitude of sibling correlation. Yet Meng Hu (2013) was unable to replicate this finding using the NLSY97 and NLSY79. Hu (2013) noted:
Finally, with regard to Jensen’s second prediction, the NLSY97 shows that the magnitude of the BW d gap is not related with the magnitude of black sibling correlations (near zero) or modestly with the white sibling correlations (around +0.20 or +0.15). The correlation between the HW d gap and sibling correlations is not trivial for whites (around +0.25 and +0.40) and for hispanics (around +0.40 and +0.50). Curiously, the correlation between BH d gap and sibling correlations is small for hispanics (around +0.10 and +0.15) but negative for blacks (-0.10 or -0.20). In the NLSY79, the magnitude of BW d gap correlates with black sibling correlations at about +0.10 and with white sibling correlations at about +0.05. The magnitude of HW d gap is positively correlated with sibling correlations for whites (around +0.40) and for hispanics (around +0.80 and +0.90). The magnitude of BH d gap shows a non-trivial negative relationship with sibling correlations for blacks (around -0.15 and -0.30) and for hispanics (around -0.25 and -0.50).
Rushton (1999) provided some more evidence, showing that the BW gap correlated with inbreeding depression. Moreover, Hu (2013) found positive statistically significant correlations between WAIS and WISC heritability estimates and the magnitude of the WAIS B/W gaps. The evidence, then, seems to be conflicting. As such, more analyses are called for.
Analysis C1. g-load, wisc ACE, BW gap, inbreeding, flynn effect, retardation
In the first analysis, I employed a method similar to that used by Meng Hu (2013, Sep, 05). My WISC ACE variable represents the standardized average ACE based on the five studies which reported Wechsler subtest variance components (Segal (1985); Luo et al. (1994); Jacobs et al. (2001); LaBuda et al. (1987); Williams (1975)). My g-loading variable came from Kan et al. (2011) who averaged WISC g-loadings from a number of different standardizations. My BW gap variable represents an average based on the scores presented in the 6 published studies which reported WISC subtest differences (Kane and Brand (2008); Naglieri and Jensen (1987); four samples reported in Jensen (1985): Jensen and Reynolds (1982), Reyolds and Gutkin (1981), Sandoval (1982), Mercer (1984)). The Inbreeding depressing variable was based on scores from Jensen (1983). The mental retardation variable is based on the average of the WISC scores presented Spitz (1988); the Flynn Effect variable is based on the average of WISC-WISCR, WISCR-WISCIII, WISCIII-WISCIV, WISCR-WISCIII, WISCR-WISCIV secular differences reported by Flynn and Weise (2007). All variables were corrected for subtest reliability. Excel file.
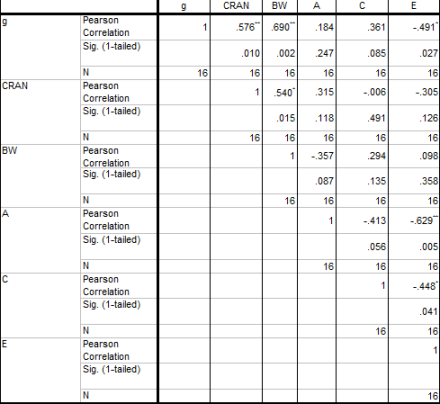
The descriptive statistics and correlational results are shown below. As seen, the BW gap only weakly correlated with heritability estimates. As expected, the Flynn Effect negatively correlated with heritability estimates and strongly positively correlates with unshared environmentality estimates.
Wisc analysis descriptive statistics
Wisc analysis correlational results
I further conducted regression analysis to elucidate some of the pathways. The results are shown below:
Wisc analysis regression results
The correlation between heritability estimates and mental retardation scores was unrelated to subtest g-loadings. G-loadings seemed to mediate what correlation there was between the BW gaps and the heritability estimates; likewise, g-loadings seemed to mediate much of the correlation between inbreeding depression scores and heritability estimates.
Analysis C2. g-load, Osborne ACE, BW gap, cranial volume
I then conducted a similar analysis using the data in Osborne (1980).
Excel file here, raw data in yellow all other scores derived. In this study Blacks and Whites were measured with the same tests at the same time. Below shows the descriptive results and the correlations found:
BW standardized differences
Black and White twin correlations
Correlations between BW and variance components estimated with Falconer’s formula
R-matrix for all variables
Here there was a negative correlation between the BW gaps and heritability estimates (and a positive one between the BW gaps and shared environmental estimates). These results held when I alternatively computed heritability estimates by n-weighting MZ and DZ correlations and then applied Falconer’s formula (as opposed to first computing the Black and Whites heritabilities separately and then averaging them.)
It was also found that the BW gap highly correlated with both the g-loadings and the cranial volume correlations reported in Jensen (1994). Additionally, shared environment estimates more positively correlated with g-loadings than did heritability estimates. To explore some of the relations more, I used regression analysis. The correlation between the BW gaps and the cranial volume correlations was mediated by g-loadings. Moreover, g-loadings seemed to moderate the negative correlation between the BW gaps and heritability estimates.
Regression analysis for select variables
Discussion: The above analyses show that the magnitude of the BW substest gaps is not consistently associated with within population heritability estimates. This suggests that either the gap is not being driven by a random sampling of the genetic differences that vary within populations or that there is some unidentified moderating influence. (Note, a zero to moderately negative correlation does not indicate that differences in this sample have no genetic basis, rather it indicates that differences are not being driven by total genetic influence; one of the weaknesses of the method of correlated vectors is that it is difficult to make sense of zero to moderate associations.)
A genetic hypothesis is not horribly damaged by these findings because this hypothesis proposes that group differences are in genetic g and because (a) genetic g shapes phenotypic g and (b) because the BW gap consistently correlates with phenotypic g. To the extent that group differences would be correlated with total heritability estimates, it would be because these are correlated with genetic g estimates. As such, total heritability and phenotypic g estimates are both one step removed from genetic g. Because the BW gap correlates with phenotypic g, despite not consistently correlating with heritability estimates, the nature of this gap is still consistent with a genetic g hypothesis. It is just not or is less consistent with a hypothesis that proposes that group differences are driven by both g and non-g genetic differences.
There are other interesting aspects of the results: (a) in the Osborne study, the correlation between the BW gaps and the cranial volume correlations was mediated by g-loadings, consistent with the results in section A and B; (b) again, in the Osborne study, the correlation between g-loadings and shared environmentality estimates was greater than the correlation between g-loadings and heritability estimates, consistent with my but not my colleague’s interpretation of the larger body of data; (c) in the WISC analysis, the strong association between mental retardation and heritability estimates was not mediated by g-loadings, thus accounting for why the BW gap negatively correlated with MR differences; (d) additionally, g-loadings mediated the association between inbreeding depression and heritability, thus making sense of why the BW gap correlated with inbreeding depression; (e) as expected the Flynn Effect negatively correlated with g-loadings and with heritability estimates.
What these results indicate is that the BW gap is in g. To the extent that the gap is genetic, it is genetic by way of g. I have argued, elsewhere, that this situation is consistent with both a shared environmental g and a genetic g hypothesis, at least insofar as shared environment can induce g-loaded differences. It is not consistent with a nonshared environmental explanation and this includes a Gx(e^2) (gene x unshared environment) explanation such as that proposed by Flynn and Dickens (2001). This is because unshared environment simply does not induce g-loaded differences. The situation will not change if genes are predisposing one to seek out unshared environments. Now, since G x (c^2) (genes x shared environment) is a nonreality, this means that group differences are due to some combination of G + C, and not G + C + GxC. (In case someone is wondering, the non reality of G x c^2 can be deduced from the large GCTA heritability estimates, estimates which are based on the genetic similarity between random individuals within a population. Since the GCTA additive genetic component is practically the same magnitude as the classic narrow heritability component, and since GCTA estimates are not confounded by shared environment, kinship heritability, in turn, can not be confounded by shared environment. Actually, the GCTA estimates support the position that Gene x Environment IQ correlations, in general, are trivial; this is because COV(GE) has no influence on variance component estimates as estimated by comparing MZ and DZ intraclass correlations, so long as the equal environments assumption is correct; if the equal environments assumption is incorrect and there is greater intrapair environmental differences for DZ twin than for MZ twins, increasing COV(GE) will result in increasing heritability as indexed by comparing MZ and DZ intraclass correlations; GCTA estimates, though, strongly support the equal environments assumption — and therefore argue against the presence of significant COV(GE).) To the extent that there is GE, then, it is Ge^2; and since e^2 does not induce Jensen Effects, we can confidently infer that the BW difference is not due to some type of GxE effect or any type of so called social multiplier.
Analysis D. Osborne and Differential Regression
Osborne’s data also allowed for a differential regression analysis. The scores from Osborne (1980) pg. 112 can be accessed here. Using these scores, I graphed the regression lines. The figure shows the sibling regression lines using all of the data points. As can be seen, the results were very similar to those found by Jensen (1973), Murray (1999), Hu (2013), and Hu (2013). In light of these collective results, the phenomenon of differential regression without convergence at the upper extremes with respect to the BW gap deserves to be considered an empirical fact.
Discussion: In a commentary on Hu (2013), I discussed the meaning of differential regression. I noted that, while not consistent with a predominantly unshared environmental model of group differences, it is difficult, based on them, to distinguish between a genetic and a shared environmental hypothesis. From a shared environmental perspective, the only curiosity is that the regression lines do not converge at the far right as one would expect unless one proposed an outlandish scenario where there was a constant shared environmental effect that left no blacks unaffected relative to Whites and yet which somehow nonetheless managed to produce results which were unconditioned on race (as shown by measure invariant studies). That said, as I noted before, one would have to model all possible scenarios of effects to draw any confident conclusion. And doing so exceeds my level of patience with this matter.
Analysis E. Add Health Longitudinal Stability
I consider it important to hammer in the point that the BW gap is primarily due to inherited factors, either of the genetic or the shared environmental kind. This way, the scope of investigation is greatly narrowed. One simple prediction that a non-shared environmental (or gene x non shared environmental) explanation does not make is that gaps will be longitudinally stable. This is because non shared environmental effects typically don’t condition longitudinally stable effects. That this is the case was shown in a recent study by Beaver et al. (2013). Those results are shown below:
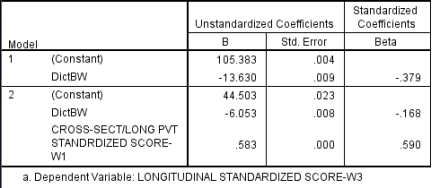
Using the add health data, we can determine if the BW gap does or does not exhibit such stability. To do this, I simply created a Black-White variable and correlated it with wave III PPVT scores; after, I looked at the effect of Wave I PPVT scores on this association. The results are shown below:
As can be seen, 60 some percent of the gap in Wave III is explained by the gap in Wave I. In this same sample, the within population Wave I scores also explained roughly the same percent of the Wave III scores within both the Black and the White populations. Were one to correct for longitudinal reliability, the majority of the Wave III BW gap would be explained by the Wave I gap.
The BW gap exhibits strong longitudinal stability. This stability can only be explained by genetic or shared environmental factors. Given this, from a environmental perspective, it is odd that shared environment explains so little of the differences within both populations. For example, two studies have been conducted on the Add health data which report shared environmentalities and heritabilities by race. The weighted averaged shared environmentality was 0.14 for Blacks and 0.09 for Whites and the weighted averaged heritability was 0.57 for Blacks and 0.63 for Whites (Rowe et al.,1999; Guo and Stearn, 2002). The environmental model has to account for how there is such a large and stable difference — 0.95 SD in this sample — despite the trivial correlation between IQ and shared environment and the not so large — at least in this sample — within race environmental correlation between IQ at time 1 and IQ at time 2.
Conclusion: In this post, I have briefly presented several analyses. The results can pithily be summarized as follows: The US Black White gap is in g. It is either due to genetic g or to shared environmental g. Taking all of the evidence together (reviewed here and elsewhere), it can not be reasonably doubted that there are genetic g differences; however, it is difficult to dispositively prove this.
Discover more from Human Varieties
Subscribe to get the latest posts sent to your email.













mediated by g-loading (whatever that would mean) cannot be taken to mean mediated by g
A moment’s reflection reveals that describing Kan’s index as a measure of “cultural loading” is misleading. Correct characterization of the index is obviously critical to understanding the results, but what is a correct characterization? It is expected that smarter people will come to know more than the less favored..