According to Spearman’s hypothesis, black-white gaps on cognitive tests are larger on tests that are better measures of g, or general mental ability. If g is the only or main source of the black-white gap, it indicates that within- and between-race differences are qualitatively similar and that understanding the nature of the racial gap requires that we understand the nature of g.
One of the ways that the late Arthur Jensen used to test the hypothesis was the method of correlated vectors (MCV). It involves factor analyzing a battery of cognitive tests taken by a sample of individuals from different races, and correlating the resultant vector of g loadings with the magnitudes of racial differences on each subtest of the battery. The expectation is that tests with higher g loadings are associated with larger racial gaps. Jensen did a number of analyses of this kind, and found that the average correlation between g loadings and subtest differences across many different samples of blacks and whites was 0.63 (after correction for unreliability), supporting the notion that g is the main source of the black-white gap. Analyses of Hispanic-white gaps have also generally supported the idea that g is their major source.
John Fuerst and I studied Spearman’s hypothesis in the NLSY97 sample. The sample sizes in the NLSY97 are ~4400 for whites, ~2300 for blacks, and ~1800 for Hispanics, although they may be lower in specific analyses below. We mostly followed the procedures in Nyborg & Jensen 2000, although we used principal axis factoring rather than PCA. The NLSY97 participants took the ASVAB, which comprises the following tests:
General Science (GS)
Arithmetic Reasoning (AR)
Word Knowledge (WK)
Paragraph Comprehension (PC)
Numerical Operations (NO)
Coding Speed (CS)
Auto Information (AI)
Shop Information (SI)
Mathematics Knowledge (MK)
Mechanical Comprehension (MC)
Electronics Information (EI)
Assembling Objects (AO)
The ASVAB yielded a similar two-factor structure across the black, white, and Hispanic samples. The first factor, which we identified as g, explains about 60 percent of the variance in the ASVAB, while the second factor explains about 10 percent; the rest can be regarded as test-specific variance and measurement error. The second factor is not very easily interpretable, but I would tentatively consider it as representing technical knowledge because it has some of its highest loadings on the Auto and Shop Information tests, which have questions like this:
A fuel-injected engine does not need:
(A) spark plugs
(B) a fuel pump
(C) a carburetor
(D) an alternator
The ASVAB is the Armed Services Vocational Aptitude Battery, so it contains also items that would not show up in a typical IQ test. I’ll call the second factor the T factor.
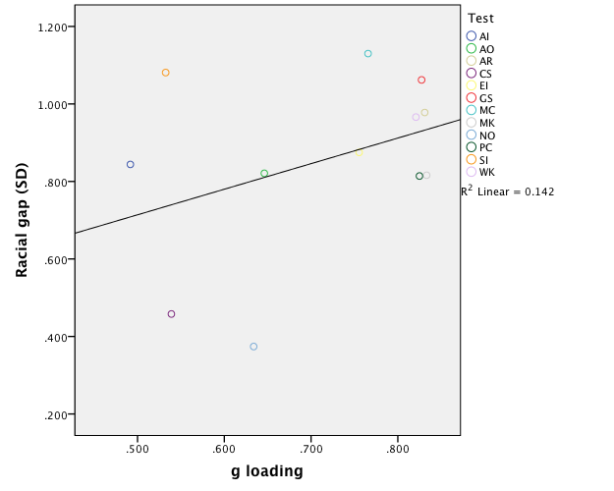
We correlated the averaged g loadings of each race/ethnicity pair with the magnitudes of white-black, black-Hispanic, and white-Hispanic gaps on each ASVAB test. All the Pearson’s r and Spearman’s rho analyses showed small to moderate positive correlations, none of which were statistically significant at conventional levels (significance testing is based on Spearman’s rho in these analyses, see Nyborg & Jensen 2000 for details). For example, here’s the scatter plot from the black-white analysis:
Pearson’s r’s for white-black, black-Hispanic, and Hispanic-white comparisons were 0.38, 0.12, and 0.39, respectively, while the corresponding Spearman correlations were 0.14 (ns), 0.077 (ns), and 0.287 (ns).
However, it could be that the expected correlations aren’t there because of confounding due to different reliabilities of the tests. However, controlling for reliabilities doesn’t substantially change the results (not shown here).
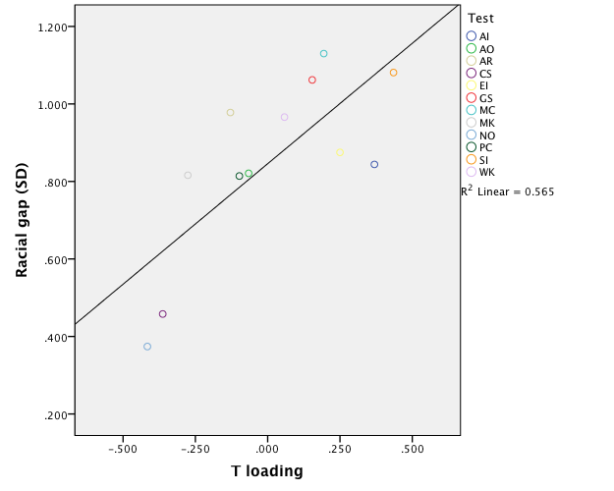
Therefore, the MCV does not support the hypothesis that g is driving the racial/ethnic differences in the ASVAB tests. So what then explains the fact that gaps differ across tests? I correlated the loadings of the second factor, the T factor, with differences in test means between whites, blacks, and Hispanics. Surprisingly, the T factor is strongly (r=0.75, rho=0.72) and highly significantly (p<0.01) correlated with the magnitudes of the gaps in the black-white analysis. The results hold even when partialling out reliabilities. The scatter plot looks like this:
In the black-Hispanic and Hispanic-white analyses the results are broadly similar, although the correlations are somewhat smaller and not always significant. Thus the racial/ethnic gaps are not only not explained by differences in g loadings, but are in fact explained by loadings on the T factor which is uncorrelated with g! Does this mean that T and not g is the main source of racial/ethnic differences in ASVAB abilities? In fact, it does not indicate that, and these analyses only demonstrate the shortcomings of the MCV.
One way of studying how different factors contribute to differences between the mean scores of races/ethnicities is to do a point biserial correlation between each racial/ethnic dichotomy and scores on each test and partial out factor scores on either factor. Here’s the results from the black-white analysis (all the results below are significantly different from zero unless otherwise indicated):
| Zero-order | g partialled out | T partialled out | |
| GS | 0.358 | 0.052 | 0.337 |
| AR | 0.339 | .003 ns | 0.377 |
| WK | 0.321 | .002 ns | 0.322 |
| PC | 0.284 | -0.083 | 0.317 |
| NO | 0.130 | -0.143 | 0.261 |
| CS | 0.170 | -0.060 | 0.275 |
| AI | 0.295 | 0.111 | 0.217 |
| SI | 0.368 | 0.188 | 0.317 |
| MK | 0.279 | -0.067 | 0.357 |
| MC | 0.378 | 0.111 | 0.350 |
| EI | 0.289 | -.006 ns | 0.249 |
| AO | 0.297 | 0.034 | 0.315 |
As can be seen, partialling out g scores removes most of the gaps in all tests, while partialling out T scores has only a small effect. Thus g is the main source of cognitive differences between blacks and whites, while T is a minor source. For some reason, T is nevertheless a major source of differences between the relative sizes of gaps on different tests, which is why the MCV analysis fails.
The results from Hispanic-white analyses are rather similar:
| Zero-order | g partialled out | T partialled out | |
| GS | 0.262 | 0.068 | 0.238 |
| AR | 0.198 | -0.054 | 0.212 |
| WK | 0.236 | 0.036 | 0.222 |
| PC | 0.179 | -0.069 | 0.188 |
| NO | 0.139 | -0.020 | 0.207 |
| CS | 0.105 | -0.045 | 0.162 |
| AI | 0.19 | 0.068 | 0.148 |
| SI | 0.248 | 0.106 | 0.206 |
| MK | 0.175 | -0.056 | 0.214 |
| MC | 0.211 | -0.002 ns | 0.181 |
| EI | 0.216 | 0.026 | 0.179 |
| AO | 0.097 | -0.101 | 0.114 |
Finally, black-Hispanic differences:
| Zero-order | g partialled out | T partialled out | |
| GS | 0.102 | -0.012 | 0.122 |
| AR | 0.167 | 0.081 | 0.224 |
| WK | 0.09 | -0.032 | 0.121 |
| PC | 0.12 | -0.004 ns | 0.163 |
| NO | -0.028 | -0.162 | 0.075 |
| CS | 0.072 | -0.027 | 0.147 |
| AI | 0.127 | 0.060 | 0.105 |
| SI | 0.14 | 0.117 | 0.159 |
| MK | 0.117 | -0.018 | 0.189 |
| MC | 0.208 | 0.168 | 0.229 |
| EI | 0.073 | -0.024 | 0.100 |
| AO | 0.256 | 0.192 | 0.272 |
Overall, these results support the hypothesis that g is the major source of racial/ethnic differences in the ASVAB, particularly between whites and blacks. The analysis also shows that the MCV is a flawed method, which is of course well known. For example, according to Ashton and Lee 2005, “first, associations of a variable with non-g sources of variance can produce a vector correlation of zero even when the variable is strongly associated with g; second, the g-loadings of subtests are highly sensitive to the nature of the other subtests in a battery, and a biased sample of subtests can cause a spurious correlation between the vectors.”
Multi-group confirmatory factor analysis appears to be a much better method for testing Spearman’s hypothesis. At the moment, that method is unfortunately beyond my skills and patience.
In part 2 of this post I’m going to extend this analysis to differences in skin color.
See here for John’s SPSS syntax for combining the ASVAB variables (there are two of them for each test), regressing out the effect of age on ASVAB scores, and performing a factor analysis on the ASVAB.
Discover more from Human Varieties
Subscribe to get the latest posts sent to your email.


“The second factor is not very easily interpretable, but I would tentatively consider it as representing technical knowledge because it has some of its highest loadings on the Auto and Shop Information tests,”
Off-topic, but somewhere in the military literature, somebody has probably looked at questions related to how well advanced mechanical knowledge could be rapidly acculturated into farmboys during WWII.
My impression is that at the start of the war, the populations of Japan and the U.S. were similar in mechanical skills necessary for, say, naval aviation. But each time the two navies sank each other’s aircraft carriers, the Japanese lost a larger fraction of their _potential_ population of state of the art mechanics. It wasn’t just that the U.S. population was considerably larger at 132 million to Japan’s 73 million in 1940, but that a very large fraction of America’s male population had tried their hands at shade tree auto repair on Model T’s and the like, and these people could rapidly be mobilized in the vast industrial expansion that overwhelmed the Japanese. In Japan, the fraction of the population at the beginning of the war that had been working with internal combustion engines and the like was extremely skilled, but was much smaller than in the U.S.