The PDF and data file are available at Open Behavioral Genetics. You can also read the article below the cut.
Published: September 15, 2014
John Fuerst [1]
Dalliard
Abstract: The authors conducted a meta-analysis of interactions between behavioral genetic variance components (ACE) and race/ethnicity for cognitive ability. The differences between the variance components for Black and White Americans were small, despite the large average test score differences. More substantial differences were found between Hispanics and non-Hispanic Whites, though results were based on only two studies. A biometric re-analysis of the CNLSY survey was then conducted and new meta-analytic results were provided. Results were discussed in light of the bio-ecological model which proposes that when the scores of subgroups are environmentally depressed, heritabilities will be likewise.
Keywords: Race, Ethnicity, Heritability, IQ, Environment, ACE model, bio-ecological model
Introduction
In behavioral genetic research, IQ variance is usually partitioned into three components: additive heredity (h2), shared environment (c2), and unshared environment (e2). These are also known as the ACE components. h2 (also referred to as a2) denotes genetic effects that act additively and independently of each other[2]. c2 refers to environmental effects that serve to make family members more similar, while e2 consists of those non-genetic effects that are not shared between family members but differentiate them from each other; if not corrected for, e2 also includes measurement error. c2 and e2 are collectively known as environmentality. The basic biometric model assumes that environmental and genetic influences are additive, but there may also be interactions between them, and these can be estimated as well (Plomin, et al., 2008).
The relative importance of genetic and environmental sources of IQ differences in White populations is an extensively studied subject. The results conclusively show that genetic variation is the main cause of individual differences in IQ after early childhood. The family environment has been shown to be a relatively unimportant source of cognitive variation in Whites. Generally, in early childhood genetic effects explain less than 50 percent of IQ variance, and the effect of the shared environment is strong. As children age, genetic effects become more and more prominent and the shared environmental variance decreases. In adults, h2 is in the range of 60–80 percent, while c2 is small if not zero; e2, which includes measurement error, explains the rest (McGue, et al., 1993; Tucker-Drob, et al., 2013).
In contrast, the heritability of IQ in Black and Hispanic Americans is less studied. Nevertheless, there are a small number of studies that allow for heritability comparisons between White, Black, and Hispanic samples. We will review these studies to determine whether the magnitudes of the genetic and environmental parameters interact with race/ethnicity. Such analyses directly indicate only the sources of within-race differences, but they nevertheless have important implications for understanding the causes of the Black-White and Hispanic-White mean differences in IQ, which research consistently shows to be about 1 and 0.7 standard deviations, respectively (Roth et al., 2001). [3]
It has been hypothesized that groups of individuals raised in cognitively depressing environments will show lower heritabilities and higher environmentalities relative to those raised in advantaged environments. This hypothesis has led to the prediction, on the assumption that social class and racial/ethnic differences in IQ are primarily environmental in origin, that lower-scoring social class and racial/ethnic groups will show lower heritabilities than higher-scoring ones (Scarr-Salapatek, 1971; Bronfenbrenner and Ceci, 1994; Guo and Stearns, 2002). There is some evidence that the heritability of IQ is lower for lower social class groups, at least in the U.S. (Turkheimer and Horn, 2014). Regarding racial and ethnic groups, no systematic review has been conducted and narrative reports have drawn opposing conclusions (cf., Jensen, 1998; Scarr, 1981).
Meta-analysis: Method
We conducted a literature search for papers containing either heritability estimates or kinship correlations that would allow for the computation of such estimates for racial and ethnic groups in the U.S. First, we reviewed the pre-1990 literature discussed by Loehlin (1975), Jensen (1998), and Rushton and Jensen (2005). After that we conducted a Boolean PsycINFO search for papers that contained the terms “heritability” and “race/ethnic/African American/Black/Latino/Hispanic” and “Cognitive/Achievement.” Our inclusion criteria were as follows: the data had to allow for the computation of ACE estimates for some measure of cognitive ability; the data had to allow for ACE estimates to be computed for Blacks or Hispanics or Asians and Whites, so to have a comparison group. When a study suggested that estimates meeting our criteria had been computed but had not been reported we contacted the authors and requested the subgroup estimates. We were able to locate seventeen studies that met or partially met at least one of our criteria. Of these, eight were excluded. The reasons for exclusion are given in Table 1.
Table 1: List of Samples Included and Excluded

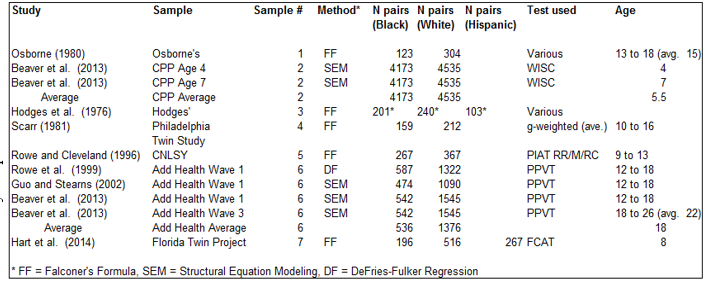
Three of the studies, Vandenberg (1970), Osborne and Miele (1969), and Osborne and Gregor (1968), were redundant with Osborne (1980) and so were excluded. One study subsample, the age 4 CPP sample presented by Loehlin et al. (1975), contained information that was redundant with that analyzed by Beaver et al. (2013) and so was excluded; another subsample presented by Loehlin et al. (1975) was excluded because it involved a measure that was primarily one of motor development not cognitive ability. In one study, Scarr-Salaptek (1971) zygosity was crudely inferred. Another, Scarr et al. (1993), was based on a highly unrepresentative transracial adoption sample and so was also excluded. Johnson, et al. (2007) was excluded because it did not contain a White reference group. Rhemtulla and Tucker-Drob (2012) was excluded because they did not report ACE estimates separately for different minority groups (Blacks, Hispanics, Asians, etc.). This left seven independent samples. Characteristics of these (variance decomposition method used, number of kinship pairs involved, tests used, and average age of the individuals) are shown in Table 2.
Two of the seven samples involved multiple estimates. One of these is #2 where Beaver et al. (2013) decomposed variance components for the same children at both age 4 and 7 in the longitudinal Collaborative Perinatal Project survey. The other sample is #6 which involves three studies by different authors who reported four different sets of estimates based on data from the National Longitudinal Study of Adolescent Health (Add Health). For samples #2 and #6, we used averages of the ACE estimates weighted by the number of kinship pairs.
Information for two of the samples came from personal communications. Kevin Beaver (personal communication, October 3, 2013; personal communication, September 24, 2013) provided ACE results obtained but not reported in the context of Beaver et al. (2014). Sara Hart (personal communication, March, 16, 2014) provided twin correlations computed in relation to (but not reported in) Hart et al. (2013).
Regarding the computation of ACE estimates, following ordinary practice, we standardized the values such that the total variance added up to 1.00 and no A, C, or E values were negative.
Table 2: Study/Sample Details
Meta-analysis: Results
The computations for each sample can be found in the supplementary file. The variance components for each sample are shown in Table 3 below. Unweighted and weighted (by total number of kinship pairs per sample) averages are provided.
Table 3: Meta-Analytic Results

Table 4 shows the Black/White and Hispanic/White differences between the average ACE estimates. These differences were computed by subtracting the Black or Hispanic ACE components from the White ones; thus, a positive difference indicates that the White variance component was higher. In Table 4, the number of pairs refers to the total number of kinship pairs for the non-White groups.
Table 4: ACE x Race/Ethnicity Interactions: Difference Between Averages

Table 5 shows the average of the differences for these same groups. This is the preferable estimate since the average of differences, unlike the difference of averages, controls for the specific effects of survey samples. Regarding Blacks and Whites, the n-weighted (by number of Black kinship pairs) racial difference in h2 came out to 0.01, while the difference in c2 came out to 0.05. For Hispanics and Whites, the n-weighted (by number of Hispanic kinship pairs) racial difference in h2 came out to 0.20, while the difference in c2 came out to -0.24.
Table 5: ACE × Race/Ethnicity Interactions: Average of Differences

Standardized Differences in the Samples
We determined the magnitude of the mean score differences for the six samples. These are shown in table 6. For samples with multiple tests, we weighted the standardized differences by kinship sample size. There are several methods for doing this and different ones might lend themselves to slightly different results. Mean differences were not reported for two of the kinship samples (#2 and #6) so we reported the mean differences found in the total survey sample. Generally, the average Hispanic/White mean score difference (d-value) in these samples was of a similar size to that found nationally (0.7 versus 0.7), while the average Black/White d-value was somewhat smaller (0.8 versus 1.0).
Table 6: Scores Differences in the Kinship Samples.

Were a bio-ecological model correct, one might expect that d-values would positively correlate with heritability differences, such that when d-values were larger, the lower scoring population would show more depressed test heritabilities. Unfortunately, our samples do not allow us to robustly determine whether or not this is the case as they differ in participant age and test type, differences which would confound any such analysis and which cannot be controlled for given the dearth of samples available.
Effects of Excluding Other Published Studies
As the results above are based on a limited number of samples, it is important to consider the effect of our inclusion criteria. Of the studies excluded, the Minnesota transracial adoption study by Scarr et al. (1993) and a study of 8-month-old twins described in Loehlin et al. (1975) could have yielded some data. The adoption study was not included because it reported a wide array of different estimates and because the interracial adoption design made the sample highly unrepresentative. Nevertheless, it is worth mentioning that Scarr and colleagues concluded that “black/interracial children adopted by white, middle-class families appear to have the same degree of genetic influences on individual differences in their intellectual achievements as do children in the majority populations of the United States and Western Europe.” The infant study was excluded because the Bayley Scales tests used are primarily measures of motor development. This study nonetheless showed similar variance components between Blacks and Whites; the heritability estimates in this study were 64 percent for blacks and 60 percent for whites. Thus, including the results from these studies would not have materially changed our meta-analytic results regarding Blacks and Whites.
Further, we came across one study, by Rhemtulla and Tucker-Drob (2012), which investigated, based on 800 sibling pairs, whether there was a variance component × race/ethnicity interaction for math tests in the nationally representative Early Childhood Longitudinal Study Birth Cohort (ECLS-B). The authors found a heritability × SES interaction but no significant heritability × race/ethnicity one. (The h2 for Whites was 0.37 and the h2 for non-Whites was 0.35.) Unfortunately, results were not decomposed by specific non-White racial/ethnic groups. Instead, the authors compared Whites with non-Whites plus mixed race individuals; the latter groups was about 40% Black, 40% Hispanic, 7.5% Asian, and 2.5% American Indian or Pacific Islander, and 10% mixed race. Based on the information provided in the NCES summary reports for this survey, the White and the non-White groups would have differed by approximately 0.5 standard deviations on the math test. The sample was not included as differences were not decomposed by specific racial/ethnic groups; however, if it was, the results would likely not have materially changed our meta-analytic results regarding Blacks and Whites and would have likely reduced the Hispanic and White differences as no statistically significant ACE × race/ethnicity interaction was found. The ACE estimates reported by Rhemtulla (personal communication, August 1, 2014) are shown in Table 7.
Table 7: Unstandardized and Standardized Results based on Rhemtulla and Tucker-Drob (2012)

As noted above, we excluded results from one study because it did not contain a White reference group. Johnson, et al. (2007) gave a sex and age adjusted heritability of 0.73 for a test of abstract reasoning given to 476 Latino Americans who had family members with Alzheimer disease. This heritability was lower when scores were adjusted for education, but such an adjustment is inappropriate as educational differences are, in part, a consequence of IQ ones. This study did not show a particularly low heritability for Hispanic Americans.
New Analysis
One of the samples included in our meta-analysis, Rowe and Cleveland (1996), was based on the early waves of the CNLSY survey. As the authors noted, the kinship sample sizes were low and it was impossible at the time to reliably generate ACE estimates for Hispanics. We decided to repeat the analysis using the since released data for all waves.
Data and Method for CNLSY Analysis
The CNLSY is a longitudinal study surveying the children of the female participants of the NLSY79 study. It has been estimated that about 95 percent of the children of the NLSY79 women are enrolled in the CNLSY. Most of them were born in the 1980s and 1990s. The CNLSY participants have taken a number of cognitive tests. The tests used are digit span forward (DSF), digit span backward (DSB); the Peabody achievement tests of math (PIAT-M), reading recognition (PIAT-RR), and reading comprehension (PIAT-RC); and the Peabody Picture Vocabulary Test (PPVT). The tests were administered between 1986 and 2010 when the participants were approximately between 3 and 13 years old.
The CNLSY participants differ substantially in birth year but their test scores were obtained when they were of similar ages. It could be that the Flynn effect would distort the results, giving a score boost to younger children. Indeed, there is a correlation between age and ability in the CNLSY, with those born later tending to score higher. However, in their analyses of the CNLSY, Ang et al. (2010) found that the age effect is mainly explained by the fact that higher-IQ women tend to have children later in life than lower-IQ women. Evidence for the Flynn effect was found only for the PIAT-M test. This indicates that the Flynn effect cannot substantially confound our results.
The CNLSY uses three race/ethnicity categories: Black, Hispanic (of any race), and non-black non-Hispanic. This means that the sample that we refer to as ‘Whites’ includes all non-black non-Hispanics, i.e., a small number of non-Whites, mostly Asians and Native Americans, in addition to the great bulk of Whites. Each child’s race was assumed to be the same as that of his or her mother. For the behavior genetic analyses, we used the NlsyLinks R package. The package makes it easy to decompose test score variances into additive genetic (A), shared environmental (C), and non-shared environmental (E) components. We used structural equation modeling to fit ACE models to family data.
The classic twin design based on MZ (identical) and DZ (fraternal) twins reared together is the workhorse of behavior genetics. Unfortunately, the CNLSY was not designed for twin analyses and there are few twin pairs among the participants. However, as the sample includes virtually all the children of thousands of mothers, there are a large number of full sibling and half-sibling pairs in it. In addition, as there are many siblings and other relatives in the NLSY79, many of their CNLSY children are cousins to each other, including first cousins and more distant ones. The NlsyLinks package utilizes the expected coefficients of relationship among these pairings (siblings 0.5, half-siblings 0.25, first cousins 0.125, etc.) to estimate the ACE components.
We used two different approaches to estimating the genetic and environmental components. The first is the Sibling Model which is based only on full and half-sibling pairs. The second is the Extended Kinship Model which includes everything from full siblings to distant cousin pairs. The pairs are non-independent in the sense that each person can be a sibling to one or more persons and a cousin to one or more others.
The ACE components were estimated separately for the White, Black, and Hispanic samples. The estimation method relies on the assumption of equal environments for siblings, i.e., full siblings and half-siblings are expected to share trait-relevant environments to the same extent. If this assumption is violated, heritability estimate may become inflated.
Technical limitations include our inability to calculate confidence intervals, although this is not a great problem given our large samples. We report ACE estimates for all samples, and do not run tests to investigate whether other models (such as AE models) would fit better. Given that all three variance components are usually present for IQ at the ages investigated, this modeling assumption appears reasonable.
Analysis I: Sibling Model, Age Matched
Included in our Analysis I are only those full and half-sibling pairs who spent at least some of their childhood living in the same household. Cognitive abilities show substantial shared environmental influence in children, which means that ACE components cannot be reliably estimated if the sibling pairs are reared apart. A limitation in our investigation was that we could not ascertain that each pair spent all of their childhood together. Cousins, used in Analysis II, are assumed to not have been brought up together.
The analyses that follow present results divided into six age bands: 2–4, 4–6, 6–8, 8–10, 10–12, and 12–14 years. For simplicity, we will refer to these groups as the 3-year-olds, 5-year-olds, 7-year-olds, 9-year-olds, 11-year-olds, and 13-year-olds, respectively. Throughout, our analyses use standard test scores calculated in relation to national standardization samples, with the exception of the digit span tests for which raw scores were used. Within each age band, test scores were residualized for age. Not all tests were administered to all age groups, e.g., the 3-year-olds only did the PPVT. Because of the longitudinal nature of the CNLSY, each child included could contribute multiple test scores to our analysis. However, not all otherwise eligible children were tested in each biennial assessment round. Most analyses in this post use test scores as described above, but for an alternative approach to using the scores, see Analyses III and IV below.
Standardized ACE estimates for Whites, Blacks, and Hispanics by age group and test for the sibling model are presented in the supplementary file. g-scores were also calculated for age 11 individuals so that average and g-scores results could be compared. For reasons that are discussed below, the estimates for individual tests appear to be very noisy, and not much attention should therefore be paid to racial differences in ACE components in a particular test. What we are instead interested in are differences in the average ACE variances across all tests and ages. This meta-analytic approach decreases the effects of sampling variance and other artifacts and should give reasonably accurate estimates of population effect sizes.
Table 8 shows weighted average ACE variances based on Digit Span Forward, Digit Span Backwards, PPVT, PIAT-Math, PIAT-Reading Recognition, and PIAT-Reading Comprehension. Sample sizes for each test/age combination correlate at >0.98 between races, giving approximately the same weights to the same tests across races. The estimates were calculated as squares of the weighted averages of the square roots of the ACE estimates; in other words, ACE components were first transformed into Pearson’s correlations which were averaged and the results were transformed back into variances. It should be remembered that the samples are not independent, as each individual may contribute many test scores.
Table 8: Averaged Results for Age Matched sibling model

These heritability estimates (0.43–0.50) can be regarded as typical for the age range in our sample (3–13 years), but the estimates for the shared environment (0.04–0.08) are somewhat smaller than expected. In these samples and using this method, non-genetic effects are overwhelmingly of the non-shared variety (0.35–0.41). Most relevantly for our purposes, heritability appears to be somewhat greater in Whites and Hispanics than Blacks, while the influence of the non-shared environment is slightly greater in Blacks.
g-scores were derived from scores on Digit Span Forward and Backward, PIAT-M, PIAT-RR, PIAT-RC, and PPVT tests taken at age 11. The results are shown in the supplementary file. The genetic variances were 0.61 for Whites, 0.55 for Blacks, and 0.60 for Hispanics. The fact that the g scores are based on multiple tests should make the results reasonably reliable.
Analysis II: Extended Kinship Model, Age Matched
Standardized ACE estimates for Whites, Blacks, and Hispanics by age group and test for the extended kinship model are presented in the supplementary file. The average ACE variances from this analysis are shown in Table 9.
Table 9: Averaged Results for Age Matched Extended Model

Unlike in the sib analysis, the Hispanic and especially the Black heritability estimates are higher than the White ones. The age 11 g-scores showed the same pattern: the genetic variances were 0.55 for Whites, 0.86 for Blacks, and 0.88 for Hispanics. Again, these results are shown in the supplementary file.
Analysis III: Averaged-Across-Rounds Scores, Sibling Model
There are several different approaches to obtaining ACE estimates from the large and heterogeneous collection of test scores available in the CNLSY data. Above, we estimated ACE components for each test and age group separately, and averaged the obtained variance components. Alternatively, one may average the test scores across all tests, ages, and test rounds, and use the average scores in ACE analyses. Because each participant typically completed a number of different tests at different ages, these average scores reflect, to some extent, the longitudinal stability of mental ability.
So, we averaged each participant’s standard scores across all testing rounds (1986–2010) for each test (digit span total, PIAT-M, PIAT-RR, PIAT-RC, and PPVT). Additionally, we computed g scores for each individual based on those across-the-years average standard scores. Table 10 shows the results of applying the sibling ACE model.
Table 10: Results for Cross Round Sibling Model

Analysis IV: Averaged-across-rounds scores, Extended Kinship Model
We repeated Analysis III using the Extended Kinship sample. The results are shown in Table 11.
Table 11: Results for Cross Round Extended Model

Similarly to Analyses I and II, the extended kinship model suggests that heritability is greater in Blacks and, to some extent, Hispanics than Whites, while the sibling model suggests that heritability is lower in Blacks.
The results from the four analyses are summarized in table 12.
Table 12. Summary of CNLSY ACE Results

Discussion of New CNLSY Analysis
The pattern of different heritabilities and environmentalities across various tests discovered in our investigation does not necessarily indicate that the determinants of different abilities are substantially variable. There are several weaknesses in the data and methods used that tend to render all individual parameter estimates very noisy. These weaknesses include:
1) Random sampling errors. This applies especially for tests and ages with low sample sizes.
2) Systematic sampling errors. Some tests were administered selectively. For example, the PIAT-RC test was given only if the subject got a sufficiently high score on the PIAT-RR.
3) Poor psychometric properties. Some test score distributions were substantially non-normal, and the interval property of the scales used may have been more compromised than is usual with cognitive tests. Reliabilities differed between tests. See Winship (2003) for a discussion of the psychometric shortcomings of the tests used in the CNLSY.
4) Non-representative samples. Our analyses were based on all sibling and cousin pairs in the CNLSY. Because the original NLSY79 included oversamples of, for example, poor individuals, the CNLSY children cannot be regarded as representative of the US population.
5) Uncertainty associated with the behavior genetic models used. The sibling and the extended kinship models produce somewhat different parameter estimates.
One might think that little can be salvaged from these results due to these problems, but we would argue that the meta-analytic averaging of parameter estimates (or test scores, as in Analyses III and IV) greatly enhances the signal in the data and cancels out error. It does not seem that the results are greatly biased with respect to race/ethnicity, at least as far as problems 1–4 go. Estimates for individual tests may be biased by the aforementioned flaws, but as we have dozens of different sets of ACE estimates for each group, there is reason to believe that the overall results are broadly reliable.
Unfortunately, it seems clear that either the sibling model or the extended kinship model (or both) is biased with respect to race. Depending on which estimates we choose, heritability is either similar or lower or higher in Whites compared to non-Whites; the differences are too large and systematic to be put down to sampling errors. It is very difficult to say which method is the more reliable one, or how much bias there is. We suspect that the problem is non-independence across pairs (i.e., each individual can be a member of several kinship pairs), combined with the fact that the frequency of different kinship types differs between races.
New Meta-analytic Averages
Results from our CNLSY analysis varied depending on whether a sibship or an extended kinship model was used and depending on how the effect of age was taken into account (either by trying to regress it out or by matching pairs on age). Including some of the model results would have a substantative effect on our meta-analytic ones. However, even if the results which were most in line with an ACE × race/ethnicity interaction prediction were included, the meta-analytic differences would still not exhibit a large interaction. Potential results, with Rowe and Cleveland’s CNLSY results (sample #5) substituted with ours, are shown in Table 13 below.
Table 13. ACE × Race/Ethnicity Interactions: Average of Differences with CNLSY (Method II, Sibling and Extended Models)

Conclusion
In sum, our meta-analysis suggests that there are no large differences between Black and White Americans in the relative importance of genetic and environmental determinants of IQ. Regarding Hispanics and Whites, the situation is more ambiguous given the limited number of studies and the small sample sizes involved. Presumably immigrant generation and language would be confounding factors here since the scores of first generation Hispanics are likely significantly depressed by linguistic bias (see Fuerst, 2014).
Regardless, genes account for about half of the IQ variance in all three groups for which data was available, while shared and non-shared environmental effects explain the other half. Given that the samples available included mainly children and adolescents, these estimates are in line with expectations from other studies. The limited number of studies means that the results cannot be regarded as absolutely dispositive, and we cannot rule out the possibility there are modest differences in the ACE parameters across races.
In what is the most famous study on the interaction between heritability and socioeconomic status (SES), Turkheimer et al. (2003) found that the heritability of IQ in a sample of 7-year-olds was approximately zero at the low end of the SES scale, with shared environmental effects accounting for most of the IQ variance. At the high end of the SES scale the results were more or less reversed, with strong genetic and weak environmental influences. The sample analyzed by Turkheimer and colleagues was 54% black and 43% white, which has encouraged the interpretation that the study has direct implications for understanding the Black-White IQ gap. The reasoning goes that because heritability is zero in poor families, and Blacks are disproportionately poor, genes can hardly have anything to do with the lower mean IQ of Blacks. As it turns out, Turkheimer’s study provides no evidence in favor of this theory. Turkheimer et al. did not provide ACE parameter estimates for Blacks and Whites separately, and such estimates have not been published for the sample in question (the Collaborative Perinatal Project). However, Kevin Beaver and colleagues calculated these estimates in connection with Beaver et al. (2013), which used the same sample. (Beaver et al. included MZ and DZ twins, full siblings, half-siblings, and twins with uncertain zygosity, while Turkheimer et al. used only MZ and DZ twins.) The estimates were not included in the published paper, but we got them from Beaver. They were included in the meta-analysis above and are reported in Table 14 with 95% confidence intervals.
Table 14: Collaborative Perinatal Project Results

While the analysis of Turkheimer et al. shows that there is h2-SES interaction for IQ, it is clear that there is no significant h2-race interaction in the same sample. Heritability is similar and substantial across races as is the effect of the environment. The same phenomena of an ACE × SES but no ACE × race/ethnicity effect was found in the ECLS analyzed by Rhemtulla, et al. (2012) and the Add Health sample analyzed by Rowe et al. (1997) (but cf. Guo and Stearns, 2002).
The bio-ecological model and related models propose that ‘environmental disadvantage’ reduces genotype-phenotype correlations. From the perspective of such models, our findings are curious. Proponents have been very explicit, if not precise, about their predictions. Scarr-Salapatek (1971), for example, noted:
The term “environmental disadvantage” refers to the largely unspecified complex of environmental factors associated with poverty that prevents an organism from achieving its optimum development…
The environmental disadvantage hypothesis assumes that lower-class whites and most blacks live under suppressive (19, 20) conditions for the development of IQ. In brief, the disadvantage hypothesis states: (i) unspecified environmental factors affect the development of IQ, thereby causing the observed differences in mean IQ levels among children of different social classes and races; (ii) blacks are more often biologically and socially disadvantaged than whites; and (iii) if disadvantage were equally distributed across social class and racial groups, the social class and racial correlations with IQ would disappear. The environmental disadvantage hypothesis predicts that IQ scores within advantaged groups will show larger proportions of genetic variance and smaller proportions of environmental variance than IQ scores for disadvantaged groups. Environmental disadvantage is predicated to reduce the genotype-phenotype correlation (21) in lower-class groups and in the black group as a whole.
Since the genotype-phenotype correlations are comparable across racial and ethnic groups in the U.S., this implies that the lower scoring groups are genetically, not environmentally, disadvantaged. The matter is difficult to determine, since a clear quantitative prediction has not been offered regarding the effect of environmental depression on biometric variance components.
Alternatively, the results may imply that the bio-ecological model’s key prediction is incorrect. Perhaps “environmental disadvantage” between groups doesn’t tend to substantially lower heritability within disadvantaged groups. Or, as Scarr-Salapatek (1971) noted as a possibility, it could be the case that the “environmental disadvantages” are unique to one or the other population and so do not affect relative levels of genetic influence. As Scarr-Salapatek (1971) noted:
If all black children are disadvantaged to an unknown degree by being reared as blacks in a white-dominated society, and no white children are so disadvantaged, it is impossible to estimate genetic and environmental variances between the races. Only if black children could be reared as though they were white, and vice versa, could the effects of different rearing environments on the genotype distribution of the two races be estimated.
In our opinion, this latter possibility is highly improbable when it comes to the Black-White differences. Readers are referred to the discussion in Dalliard (2014).
Overall, our meta-analysis (Table 13) indicates that the heritability of IQ in Black, Hispanic, and White Americans is roughly similar. While we cannot rule out the existence of modest differences in these population parameters, but we can dismiss the idea that the determinants of IQ differences within the Black population are radically unlike those in the White population.
Notes
[1] Corresponding author: j122177@hotmail.com
[2] Some of the genetic variance in IQ is probably non-additive in nature (Vinkhuyzen et al., 2012), but due to data and modeling limitations most studies assume additivity. We follow this convention in our analyses. In practice,the estimates for additive genetic components that we report may include some interactive genetic effects; this is probably particularly true for the estimates based on Falconer’s formula, which tend to be closer to the total genetic influence than to the additive genetic influence (Falconer and Mackay, 1996).
[3] These represent crude characterizations of the magnitudes of the typically found differences. A more precise description would take into account variability by age, birth cohort, and migrant generation; to note, Dickens and Flynn (2006) found evidence of an age and birth cohort interaction with regards to the Black/White differential, while Fuerst (2014) found evidence of a migrant generation interaction with regards to the Hispanic/White difference.
References
Ang, S., Rodgers, J. L. & Wänström, L. (2010). The Flynn Effect within Subgroups in the U.S.: Gender, Race, Income, Education, and Urbanization Differences in the NLSY-Children Data. Intelligence, 38, 367–384.
Beaver, K. M., Schwartz, J. A., Connolly, E. J., Nedelec, J. L., Al-Ghamdi, M. S., & Kobeisy, A. N. (2013). The genetic and environmental architecture to the stability of IQ: Results from two independent samples of kinship pairs. Intelligence, 41, 428-438.
Berends, M., & Penaloza, R. V. (2008). Changes in Families, Schools, and the Test Score Gap. In K. A. Magnuson & J. Waldfogel (Eds.), Steady Gains and Stalled Progress: Inequality and the Black-White Test Score Gap (pp. 66-109). New York: Russell Sage Foundation.
Bronfenbrenner, U., & Ceci, S. J. (1994). Nature-nuture reconceptualized in developmental perspective: A bioecological model. Psychological Review, 101, 568-586.
Currie, J. M. (2005). Health Disparities and Gaps in School Readiness The Future of Children, 15, 117-138.
Dalliard (2014). The Elusive X-Factor: A Critique of J. M. Kaplan’s Model of Race and IQ. Open Differential Psychology.
Dickens, W. T., & Flynn, J. R. (2006). Black Americans reduce the racial IQ gap evidence from standardization samples. Psychological Science, 17, 913-920.
Falconer, D. S., & Mackay, T. F. C. (1996). Introduction to Quantitative Genetics. Harlow, Essex: Addison Wesley Longman.
Fryer, R. (2011). Racial inequality in the 21st century: The declining significance of discrimination. Handbook of Labor Economics, 4, 855-971.
Fuerst, J. (2014). Ethnic/Race Differences in Aptitude by Generation in the United States: An Exploratory Meta-analysis. Open Differential Psychology.
Guo, G., & Stearns, E. (2002). The social influences on the realization of genetic potential for intellectual development. Social Forces, 80(3), 881-910.
Hart, S. A., Soden, B., Johnson, W., Schatschneider, C., & Taylor, J. (2013). Expanding the environment: gene× school‐level SES interaction on reading comprehension. Journal of Child Psychology and Psychiatry, 54, 1047-1055.
Hodges, P. M. (1976). Estimates of Heritability in Different Populations (A Preliminary Report).
Jensen, A. R. (1998). The g Factor: The Science of Mental Ability. Westport, CT: Praeger.
Johnson, B., Santana, V., Schupf, N., Tang, M. X., Stern, Y., Mayeux, R., & Lee, J. H. (2007). The Heritability of Abstract Reasoning in Caribbean Latinos with Familial Alzheimer Disease. Dementia and geriatric cognitive disorders, 24, 411-417.
Loehlin, J. C., Lindzey, G., & Spuhler, J. N. (1975). Race Differences in Intelligence. San Francisco: Freeman.
McGue, M., Bouchard, T.J., Iacono, W.G., & Lykken, D.T. (1993). Behavioral genetics of cognitive ability: A life-span perspective. In R. Plomin & G.E. McClearn (Eds.), Nature, nurture & psychology (pp. 59-76). Washington, DC: American Psychological Association.
Osborne, R. T. (1980). Twins, black and white. Athens: Foundation for Human Understanding.
Osborne, R. T., & Gregor, A. J. (1968). Racial differences in heritability estimates for tests of spatial ability. Perceptual and Motor Skills, 27, 735-739.
Osborne, R. T., & Miele, F. (1969). Racial Differences in Environmental Influence on Numerical Ability as Determined by Heritability Estimates. Perceptual and motor skills, 28, 535-538.
Plomin, R., DeFries, J. C., McClearn, G. E., & McGuffin, P. (2008). Behavioral Genetics (5th ed.). New York: Worth Publishers.
Reichman, N. E. (2005). Low Birth Weight and School Readiness. The Future of Children, 15, 91-116.
Rhemtulla, M., & Tucker-Drob, E. M. (2012). Gene-by-socioeconomic status interaction on school readiness. Behavior genetics, 42, 549-558.
Roth, P. L., Bevier, C. A., Bobko, P., Switzer, F. S., & Tyler, P. (2001). Ethnic Group Differences in Cognitive Ability in Employment and Educational Settings: A Meta-Analysis. Personnel Psychology, 54, 297-330.
Rowe, D. C., Jacobson, K. C., & Van den Oord, E. J. (1999). Genetic and environmental influences on vocabulary IQ: Parental education level as moderator. Child development, 70, 1151-1162.
Rowe, D. C. (2002). IQ, birth weight, and number of sexual partners in White, African American, and mixed race adolescents. Population and Environment, 23, 513-524.
Rushton, J. P., & Jensen, A. R. (2005). Thirty years of research on race differences in cognitive ability. Psychology, Public Policy, and Law, 11, 235-294.
Scarr-Salapatek, S. (1971). Race, social class, and IQ. Science.
Scarr, S. (1981). Race, social class, and individual differences in IQ. Hillsdale: Erlbaum.
Scarr, S., Weinberg, R. A., and Waldman, I. D. (1993). IQ Correlations in Transracial Adoptive Families. Intelligence, 17, 541-555.
Tucker-Drob, E. M., Briley, D. A., & Harden, K. P. (2013). Genetic and environmental influences on cognition across development and context. Current Directions in Psychological Science, 22, 349-355.
Turkheimer, E., Haley, A., Waldron, M., D’Onofrio, B., and Gottesman, I. I. (2003.). Socioeconomic status modifies heritability of IQ in young children. Psychological Science, 14, 623-628.
Turkheimer, E., & Horn, E. E. (2014). Interactions Between Socioeconomic Status and Components of Variation in Cognitive Ability. In Behavior Genetics of Cognition Across the Lifespan. Advances in Behavior Genetics, 1, 41-68.
Vandenberg, S. G. (1969). A comparison of heritability estimates of US Negro and white high school students. Acta geneticae medicae et gemellologiae, 19, 280-284.
Vinkhuyzen, A. A., van der Sluis, S., Maes, H. H., & Posthuma, D. (2012). Reconsidering the heritability of intelligence in adulthood: Taking assortative mating and cultural transmission into account. Behavior Genetics, 42, 187-198.
Winship, S. (2003). Early Warning: The Persistence of Cognitive Inequalities at the Start of Schooling.
Discover more from Human Varieties
Subscribe to get the latest posts sent to your email.

Hanscombe et al 2012 do a nice review of studies that find ACE X SES interactions. The best of them is the Rowe 1999 paper. The thing that gets me about these studies – which almost always are in the U.S. and include large numbers of non-Whites – is that the interaction could be observed because the scores at low SES levels could just be really low. One would imagine low scores are more subject to substantial inflation due to chance – or at least, shared environment factors. It would seem like something to investigate to me, owing to the pattern.