An early version of this paper was posted on June 25th. The paper has since been extensively edited and corrected and, subsequently, published at Open Differential Psychology on July 25/26th, 2014. The paper and data files can be found here at the Open Differential Psychology site.
PDF.
Abstract
Cognitive ability differences between racial/ethnic groups are of interest to social scientists and policy makers. In many discussions of group differences, racial/ethnic groups are treated as monolithic wholes. However, subpopulations within these broad categories need not perform as the racial/ethnic groups do on average. Such subpopulation differences potentially have theoretical import when it comes to causal explanations of racial/ethnic differentials. As no meta-analysis has previously been conducted on the topic, we investigated the magnitude of racial/ethnic differences by migrant generations (first, second, and third+). We conducted an exploratory meta-analysis using 18 samples for which we were able to decompose scores by sociologically defined race/ethnicity and immigrant generation. For Blacks and Whites of the same generation, the first, second, and third+ generation B/W d-values were 0.79, 0.79, and 1.00. For Hispanics and Whites of the same generation, the first, second, and third+ generation H/W d-values were 0.76, 0.67, and 0.57. For Asians and Whites of the same generation, the first, second, and third+ generation d-values were -0.08, -0.21, and 0.00. Relative to third+ generation Whites, the average d-values were 0.99, 0.84, and 1.00 for first, second, and third+ generation Black individuals, 1.04, 0.71, and 0.57 for first, second, and third+ generation Hispanic individuals, 0.16, -0.18, and -0.01 for first, second, and third+ generation Asian individuals, and 0.24 and 0.04 for first and second generation Whites.
Keywords: Immigrants, group differences, race, ethnicity, aptitude, National IQ
Introduction
There are well known ethnic and racial aptitude differentials in the U.S. Most notably, self-identified non-Hispanic Black (from now on “Black”) and Hispanic Americans score, respectively, approximately 1 and 0.7 standard deviations below non-Hispanic White (from now on “White”) Americans (Roth, 2001). These differences are of interest because they account for a large portion of numerous unwanted group outcome differences (e.g., in education, income, etc.) (Fryer et al., 2011). Various etiological accounts of the aptitude differentials have been offered. When it comes to adjudicating between accounts, the performance of groups by immigrant generation can be of relevance, as a number of causal hypotheses (e.g., involuntary minority, legacy of slavery, historic discrimination, cultural bias, epigenetics, genetics, etc.) make predictions regarding differences across migrant generations. For example, John Ogbu’s involuntary minority hypothesis attributes low African American performance to oppositional differences arising from being members of an involuntary diaspora (Gibson and Ogbu, 1991). This hypothesis would not obviously predict similarly low aptitude for first and second generation individuals of the same minority group, individuals who freely migrated to the U.S. Unfortunately, no one has meta-analytically explored the magnitude of aptitude differences by race/ethnicity and generation in the U.S. As such, these various claims and positions, insofar as they relate to migrant generations, are difficult to evaluate. To address the hole in the literature, we conducted a meta-analysis of race x generation differences in the U.S.
Method
We conducted a meta-analysis based on results from 18 samples for which we were able to decompose scores by sociological race/ethnicity and immigrant generation. The following surveys were included:
1. Beginning Postsecondary Students 2004-2009 Survey http://nces.ed.gov/surveys/bps/
Analyzed with an online statistical tool (PowerStats).
2. The National Postsecondary Student Aid Study 2008 (NPSAS 2008) http://nces.ed.gov/surveys/npsas
Analyzed with an online statistical tool (PowerStats).
3. The National Postsecondary Student Aid Study 2012 (NPSAS 2012) http://nces.ed.gov/surveys/npsas/
Analyzed with an online statistical tool (PowerStats).
4. TIMSS 1995 & 1999 grade 8 http://nces.ed.gov/nationsreportcard/naepdata/
Analyzed with an online statistical tool (International Data Explorer (IDE)).
5. TIMSS 2007 & 2011 grade 8 http://nces.ed.gov/nationsreportcard/naepdata/
Analyzed with an online statistical tool (International Data Explorer (IDE)).
6. TIMSS 1995 and 2003 grade 4 http://nces.ed.gov/nationsreportcard/naepdata/
Analyzed with an online statistical tool (International Data Explorer (IDE)).
7. TIMSS 2007 and 2011 grade 4 http://nces.ed.gov/nationsreportcard/naepdata/
Analyzed with an online statistical tool (International Data Explorer (IDE)).
8. PIRLS 2006 http://nces.ed.gov/nationsreportcard/naepdata/
Analyzed with an online statistical tool (International Data Explorer (IDE)).
9. PIRLS 2011 http://nces.ed.gov/nationsreportcard/naepdata/
Analyzed with an online statistical tool (International Data Explorer (IDE)).
10. PISA 2009 http://nces.ed.gov/nationsreportcard/naepdata/
Analyzed with SPSS using publicly available data.
11. PISA 2012 http://nces.ed.gov/nationsreportcard/naepdata/
Analyzed with SPSS using publicly available data.
12. National Assessment of Adult Literacy http://nces.ed.gov/NAAL/
Analyzed with AM software using publicly available data.
13. Program for the International Assessment of Adult Competencies http://nces.ed.gov/surveys/piaac/
Analyzed with SPSS using publicly available data.
14. National Longitudinal Study of Adolescent Health (Add Health) http://www.cpc.unc.edu/projects/addhealth
Analyzed with SPSS using publicly available data.
15. General Social Survey (GSS 1972-2010) http://www3.norc.org/gss+website/
Analyzed with an online statistical tool (SDA).
16. National Longitudinal Survey of Freshmen (NLSF) http://nlsf.princeton.edu/
Analyzed with SPSS using publicly available data.
17. High School Longitudinal Study of 2009 (HSLS:09) http://nces.ed.gov/surveys/hsls09/
Analyzed with SPSS using publicly available data.
18. National Education Longitudinal Study of 1988 https://nces.ed.gov/surveys/nels88/
Used data provided in a published paper.
These surveys in particular were chosen because: (a) they allowed for scores to be decomposed by three generational groups (first, second, and third+) and four racial/ethnic groups (Whites, Blacks, Hispanics, and Asians), (b) they were mostly representative either of the U.S. national population or of the U.S. university population, (c) the data was publicly available, and (d) the tests involved were at least fair measures of general aptitude. We looked into other surveys but those did not meet one of the four criteria mentioned above or, alternatively, they were too difficult to analyze. For example, the New Immigrant Survey did not contain third+ generation data and the National Longitudinal Survey of Youth ‘97 did not readily allow for a decomposition by generations. As for published results, we did not conduct a complete review, thus we classify this as a non-systematic exploratory meta-analysis. Generally, the research which we did find and did not include did not meet one of our inclusion criteria.
For our race variable, we used U.S. sociologically defined race/ethnicity (i.e., non-Hispanic Asians (“Asians”), which includes individuals of mostly south and east Asian descent, non-Hispanic Whites (“Whites”), which includes individuals of mostly West Eurasian — minus South Asian — descent, non-Hispanic Blacks (“Blacks”), which includes individuals of mostly Sub Saharan African descent, ones largely from Africa and the West Indies, and Hispanics (“Hispanics”), which includes individuals of Latin American origin, regardless of historic biogeographic ancestry). Self-reported race/ethnicity was used for all studies. Regarding generations, we defined these as follows:
First generation — born outside the U.S. with at least one parent also born outside the U.S.
Second generation — born inside the U.S. with at least one parent born outside the U.S.
Third+ generation — born inside the U.S. with two parents also born inside the U.S.
For a couple of the studies, the definition of generation deviated from that mentioned above. For example, in the BPS study, first generation was defined as being non-U.S. born and having two non-U.S. born parents. In this instance, this was done as the survey variables did not allow for the analysis to be conducted otherwise. When, for specific surveys, generation definitions deviated from the ones noted above, this was noted in the data file.
We were unable to compute sample sizes for a number of the studies, as many were analyzed with online statistical tools and as these tools did not provide the necessary statistical options to generate sample sizes; as such, we did not report them in Table 2 and we did not weight the survey d-values when computing meta-analytic averages; even if sample sizes were available for all surveys, doing otherwise arguably would have been undesirable given the heterogeneity of the samples, which varied in birth year, age, test type, representativity, and sample size.
Standardized differences were computed relative to White 3rd+ generation scores. For simplicity’s sake, pooled standard deviations were not used. For all studies except BPS (2004-2009), NPSAS (2008), and NPSAS (2012), White 3rd+ generation standard deviations were employed instead. For the three above mentioned studies, total sample standard deviations were used as the online statistical program did not provide subgroup values. Generally not using pooled standard deviations had little effect as the White 3rd+ generation sample sizes overwhelmed the comparison group ones.
The survey characteristics (name, whether the survey was nationally representative, name of test given, the age when the test was taken by participants, and the total sample size) are listed in Table 1. Fourteen of the eighteen surveys were nationally representative; three were nationally representative of the university population, and one was not representative. Across all surveys, the total sample size was about 400,000.
Table 1: Survey Characteristics

Both to increase reliability and to keep a balance of surveys, Grade 8 1995 and 1999 TIMSS, Grade 8 2007 and 2011 TIMSS, Grade 4 1995 and 2003 TIMSS, and Grade 4 2007 and 2011 TIMSS d-values were combined.
Results
The results are presented in Table 2 below. The values approximate Cohen’s d values; these were computed by subtracting the non-White subgroup scores from the third+ generation White scores and then dividing the differences by the third+ generation White standard deviations. These results, along with computations for each of the surveys, can be found in the supplementary file. When sample sizes were too small to generate reliable results, scores were left blank in the chart and were not factored into the meta-analytic averages. NAEP’s data explorers only generate values if the sample sizes are 62 or more. For analyses conducted with SPSS, we reported results if individual sample sizes were equal to or greater than 30.
Table 2: Summary Results


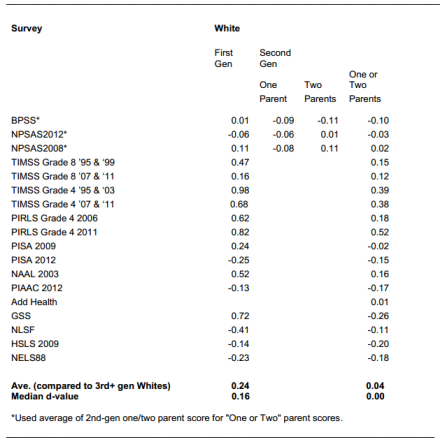
Relative to third+ generation Whites, the average d-values were 0.99, 0.84, and 1.00 for first, second, and third+ generation Black individuals, 1.04, 0.71, and 0.57 for first, second, and third+ generation Hispanic individuals, 0.16, -0.18, and -0.01 for first, second, and third+ generation Asian individuals, and 0.24 and 0.04 for first and second generation White individuals. On a reviewer’s request, median d-values were also reported in Table 2.
One can also compare scores by generation using the d-values given in Table 2. For the third+ generation, the value is simply the average Black, Hispanic, and Asian third+ generation d-value. For the first generation, it is the average of the differences between the White first/White third+ generation d-values and the respective Black, Hispanic, and Asian first/White third+ generation d-values. For the second generation, it is the average of the differences between the White second/White third+ generation d-values and the respective Black, Hispanic, and Asian second/White third+ generation d-values. For Whites and Blacks of the same generation, the first, second, and third+ generation B/W d-values were 0.79, 0.79, and 1.00. For Hispanics and Whites of the same generation, the first, second, and third+ generation H/W d-values were 0.76, 0.67, and 0.57. For Asians and Whites of the same generation, the first, second, and third+ generation A/W d-values were -0.08, -0.21, and 0.00.
Discussion
In the case of Blacks, Whites, and Asians there was a high degree of cross generational stability in aptitude. Across generations, scores were much more variable for Hispanics. No obvious pattern that allows for a relatively simple comprehensive explanation stood out. Specific group differences are discussed below.
White-White gaps
On average, first, second, and third+ generation Whites performed similarly. As such, comparisons between Whites and other groups were largely unaffected by taking into account generation with respect to Whites. The cross-generational similarity in performance is somewhat surprising given that national backgrounds differ substantially across generations. Third+ generation Whites are almost entirely of European extraction while first and second generation Whites include a substantially larger number of greater Middle Eastern and Central Asian immigrants. The latter individuals substantially differ from the former in genetic, cultural, religious, and linguistic background. Generally, based on the reported regional ability differences (e.g., Lynn and Vanhanen, 2012) and the ethnic compositions of the different generations, one might expect first and second generation Whites to non-trivially under-perform third+ generation ones. This seems to not be the case, at least for 2nd generation individuals. This issue is difficult to investigate further using the data sets utilized in the present study, so a more detailed exploration of it will have to wait for a future analysis.
Black-White gaps
First generation. The first generation Black- 3rd+ generation White differential is surprisingly small at 0.99 SD given the National IQs reported for Black majority countries. Rindermann (2013) reports an average Black African regional IQ of 75, while Lynn and Vanhanen’s (2012) estimates give a Caribbean regional IQ of approximately 82. (Presumably the average Black Caribbean IQ would be slightly lower as it is generally found that Black West Indians perform less well than non-Black ones (Lynn, 2008)). Taking into account the distribution of Black immigrants by region of origin, one would predict a first generation Black IQ of about 80 were regional IQ estimates accurate, were migrants representative with respect to region of origin aptitude, and were U.S. tests relatively psychometrically unbiased for first generation individuals of this group. Thus Black immigrants perform about 0.33 SD better than one would expect based on Lynn and Vanhanen’s (2012) and Rindermann’s (2013) estimates. Black migration to the U.S. and to Europe both from Africa and from the West Indies is, however, very selective with respect to human capital (Model, 2008; Easterly and Nyarko, 2008). This selectivity could account for some of the difference. Alternatively, the latent ability of Black majority nations could be underestimated and the higher than predicted Black immigrant ability could reflect this. This issue will require more investigation.
Second generation. The second generation Black/ third+ generation White gap is around 0.84 SD. It is not obvious why this is smaller than both the first and third+ generation gaps. Perhaps psychometric bias (e.g., linguistic bias) artificially lowers first generation Black aptitude scores; such bias would be expected to be lower in the second generation. If so, the second generation Black aptitude might be closer to the unbiased migrant group aptitude. Alternatively, there might have been a genuine first to second generational cognitive ability gap narrowing in unbiased aptitude and 3rd+ generation Blacks might not have experienced the positive effect of U.S. residency due to mitigating factors such as historic discrimination.
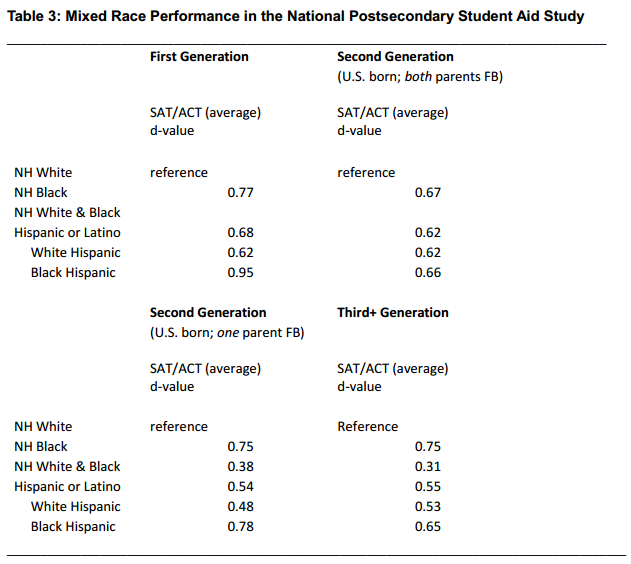
If there was a genuine first to second generation aptitude narrowing, this could in part be due to intermixture, since second generation individuals are more likely have mixed heritages than are first generation ones. An admixture effect is unlikely to account for much of the difference, though, since, for many of the studies, mixed race individuals were excluded. Nonetheless, to explore this possibility, we took a closer look at the National Postsecondary Student Aid Study which conveniently had a very large overall sample size (of 95,000). Results are shown below in Table 3. ACT and SAT d-values were computed relative to Whites of the same generation and then averaged. As can be seen, both second and third+ generation mixed non-Hispanic B+W individuals performed roughly intermediate to second and third+ generation mono-race individuals. Thus there was an intermixing effect for both generations.
This finding is consistent with that of Fuerst (2014), who found, in the NLSF, a color-IQ correlation for second generation Blacks but not for first generation ones. The author proposed that the color-IQ association was due to White (cultural and/or genetic) admixture and that this did not show up among first generation Blacks because many of them, at least in the sample analyzed, came from countries (e.g., Nigeria) in which there was very little admixture.
Despite there being an admixture effect, this counted for little of the first to second generation difference. Table 4 below shows NPSAS 2012 scores by generation for individuals aged 15 to 23 with Blacks defined both inclusively (including self-reported mixed race individuals) and exclusively (excluding self-reported mixed race individuals). Because there were relatively few second generation Black individuals who reported being mixed race, using an inclusive definition had little effect on the overall scores
Table 4: Mixed Race Results by Generation for NPSAS 2012

These results suggest that admixture is not driving much of the apparent first to second generational narrowing of the B/W gap.
Third+ generation. The found third+ generation gap of 1.00 SD is consistent with other reviews which also report a 1 standard deviation difference. Unfortunately, it is nearly impossible to disentangle third generation Black individuals from greater than third generation ones. Thus it is impossible to ascertain if there is a narrowing between the second and third generation.
African versus West Indian origin Blacks
It has been suggested that the African migrant IQ might be on par with that of Whites; if so, the first and second generation Black /third+ generation White gaps would have to be driven by the underperformance of West Indian and other origin Blacks. This isn’t inherently statistically implausible since Black African immigrants, as shown below in Table 5, comprised only between 8 and 24% of the Black immigrant pool between 1980 and 2000, the immigrant cohorts which would have birthed most of the survey participants for the surveys analyzed. (Table 5 was based on the immigrant numbers presented in Capps et al. (2012); percentages were computed from immigrant numbers.) Of course, the conjecture becomes less and less plausible as time goes on — as Black Africans comprise a larger percent of the Black immigrant pool and as the Black immigrant performance fails to increase.
Table 5: Percent of Black Immigrants to the U.S. by Region of Origin, 1980 to 2008*

Whatever the case, we can look at what little data there is. Richwine (2009) reported aptitude scores calculated based on digit span backwards subtest results. These results come from the New Immigrant Survey. On this subtest, first generation individuals of Sub Saharan African origin (n=54) scored 0.3 standardized units (SD) below the US average, while first generation individuals of Central American and Caribbean origin (n=96) scored 0.51 SD below the US average. Adjusting for g-loadedness, Richwine (2009) found that these differences came out to about 0.73 and 1.2 SD below the average. Unfortunately, scores were not decomposed by race/ethnicity.
Some information can be extracted from the General Social Survey. Wordsum (a short vocabulary test) results for African and West Indian Blacks are shown below in Table 6. The third+ generation White mean was 6.43 (SD 1.78). First and second generation Black Sub-Saharan Africans (n=40) and Black West Indians (n=32) scored, respectively 1.2 and 1.1 SD below third+ generation Whites.
Table 6: General Social Survey (1972-2012) Wordsum Scores for First and Second Generation Blacks by Region of Origin

The sample sizes were small and so the results cannot be given much weight, but they do not suggest the existence of large region of origin differences. We also computed scores using the (non-nationally representative) NLSF sample. These are presented below in Table 7. The third+ generation White mean was 30.42 (SD 3.13). First and second generation Black Sub-Saharan Africans (n=67) and Black West Indians (n=93) scored, respectively, 0.9 and 0.9 SD below third+ generation Whites.
Table 7: ACT/SAT Scores for First and Second Generation Self-Reported Black Americans in the NLSF*

Again there was no evidence of a region of origin difference. This issue deserves further investigation.
Hispanic-White gaps
The multi-racial U.S. Hispanic population is largely of Mexican (63%) and Puerto Rican (9%) extraction. Roth et al. (2001) reported a meta-analytic Hispanic/non-Hispanic White d-value of 0.72 for g across all generations.
First generation. First generation Hispanics score 1.04 standard deviations below third+ generation (non-Hispanic) Whites. This score is larger than the roughly 0.87 predicted by L&V’s National IQs. The L&V (2012) estimate is calculated as shown in Table 8 below. Linguistic bias most likely depresses the mean performance of first generation Hispanics, at least on verbally loaded tests, and this bias probably accounts for a non-trivial percent of the unexpectedly low first generation Hispanic scores.
Table 8: Largest U.S. Hispanic Groups and L&V’s 2012 National IQs*

While on average Latin Americans are less selected than individuals from other regions, they are not negatively selected – that is, they don’t have lower levels of human capital than those left behind (see: Feliciano, 2005). Kaestner and Malamud (2010) used the Mexican Family Life Survey (MxFLS) to investigate this issue further. They found that, relative to stayers, Mexican migrants were positively selected in education and neutral with respect to cognitive ability (as measured by Raven’s matrices). The authors noted:
[M]igrants are relatively similar to non-migrants with respect to cognitive ability. Rates of migration do not differ significantly by categories of cognitive ability, although there is some evidence of positive selection for women. The absence of any strong evidence for the selection of migrants with respect to cognitive test scores is surprising given the selection on education and the relatively high positive correlation between years of schooling and cognitive test score (r=0.49). This finding implies that education and cognitive ability do not have similar associations with the costs and benefits of migration even though the two variables are correlated.
Negative selection, then, is not likely a good explanation for the low performance.
Second generation. The second generation Hispanic/ third+ generation White gap is around 0.71 SD. There is a first to second generation reduction in the size of the gap of about one third of a standard deviation. This likely is due, in part, to a lessening of linguistic bias. There are three reasons to suspect that such bias is minimal by the second and subsequent generations. For one, when second+ generation math scores are adjusted for potential psychometric bias in the form of differential item function, the differences remain large (see, Richwine, 2009, Table 2.11). For another, in a recent study based on a large norming sample, measurement invariance (MI) has been found to hold between non-Hispanic Whites and (presumably mostly second+ generation) Hispanics (Trundt, 2013); MI indicates that group differences are of the same psychometric nature as differences within groups and thus that there is no detectable psychometric bias. Third, the differences between English-only speaking 2nd+ generation Hispanics and Whites is about as large as the difference between all 2nd+ generation Hispanics and Whites.
Third+ generation. The third+ generation difference, at 0.57, was found to be slightly smaller than the second generation difference. Based on findings reported by others, it appears that the generational decrease stalls between the second and third generation. For example, Hansen et al. (2010) report scores for male children of natives (i.e., fourth+ generation) based on the NLSY79 and NLSY97 surveys; the scores were, respectively, 0.8 and 0.53 SD below the non-Hispanic White fourth+ generation ones. Holding generational effects constant, there appeared to be some secular narrowing. The results are shown in Table 9.
Table 9: AFQT Scores by Ethnicity and Generation for Males 16 and Younger in the NLSY ‘79 and ’97 *

Some might maintain that language is behind the low scores of third+ generations Hispanics. However, the relative performance of English-only speaking Hispanics suggests otherwise. For example, third+ generation English-only speaking Hispanics perform only marginally better than all Hispanics of the same generation. TIMSS (2007) results are shown below in Table 10.
Table 10: TIMSS Math and Science Performance by Home Language Use for Grade 8 3rd+ Generation non-Hispanic Whites and Hispanics

Assuming that there is a robust second to third+ generation cognitive ability narrowing, some of this could be due to cultural and genetic assimilation. There is some evidence in support of this view. First, individuals with two Hispanic parents perform worse than ones with one White and one Hispanic parent. Table 11 shows NLSY 97 scores for individuals with two NH White parents, one NH White and one Hispanic parent, and two Hispanic parents. White parentage is associated with a substantial increase in ability.
Table 11: NLSY 97 IQ and Achievement Scores by Parent’s Race and Ethnicity

Similar results show up in the Add Health sample and in the HSLS 2009 sample. The latter are shown below in Table 12.
Table 12: Math Scores by Parental Ethnicity by Generation in the HSLS 2009

Second, the self-identifying Hispanic population increasingly becomes genetically Europeanized with generations. That is, the portion of non-Hispanic White ancestry that self-identifying U.S. Hispanics have increases with generation. For example, the percent of self-identifying Hispanic individuals (hailing for two parent households) in the HSLS 2009 survey with one non-Hispanic White parent is given below by generation in Table 13. As can be seen, with increasing generations, an increasing portion of self-identified Hispanics have one non-Hispanic White parent. Since White parentage is associated with increased scores, it would not be unreasonable to conjecture that a beneficial generation x assimilation effect exists.
Table 13: Percent of Self-Identified Hispanics in the High School Longitudinal Study of 2009 with non-Hispanic White Parents

Such an effect could readily account for the generational narrowing. If the second generation Hispanic/White difference of 0.71 standard deviations was fully inherited (environmentally and/or genetically), given that 32% more of third+ generation Hispanics have one non-Hispanic White parent, one would expect a generational increase in Hispanic scores of about 0.11 SD, going from the second to third+ generation, solely owing to the increase in non-Hispanic White parentage (0.32 x ½ x 0.71 SD = 0.11 SD), an increase which is not significantly different from the Hispanic second to third+ generation difference found (0.71-0.57 = 0.13 SD). Whatever the case, the effect of assimilation across generations on the overall scores differences requires a thorough investigation, one which stands outside the narrow scope of this paper.
Asian-White gaps
“Asian Americans” are a genetically, culturally, and linguistically heterogeneous group which include East Asians, South Asians, and (in many surveys) Pacific Islanders. First generation Asians perform slightly worse than 3rd+ generation White Americans; the gap comes out to about 0.16 standard deviations. Second generation Asians tend to perform better by 0.18 SD, while third+ generation Asians perform on par. Across all generations, the average Asian performance is non-trivially higher than their Lynn and Vanhanen estimated nation of origin IQs would predict. Table 14 below shows the national origins of Asian Americans along with the corresponding L&V (2012) national IQs.
Table 14: Largest U.S. Asian Groups and L&V’s 2012 National IQs*

Based on the National IQs, one would predict a mean Asian American aptitude nearly 0.4 standard deviations below that of Whites — not 0.16 below for the first generation and then approximate 0.18 SD and 0.01 SD above for, respectively, the second and third+ generations. As the discrepancy can be found among first generation Asian immigrants, it cannot fully be ascribed to generational factors e.g., better rearing environments and cultural assimilation; in short, Asian immigrants come to the U.S. with higher aptitudes than one would predict based on L&V’s (2012) estimated National IQs. Some of this could be accounted for by immigrant selection, which is substantial for this region of the world (see: Feliciano, 2005). There also could be an ethnic composition effect; for example, many Filipino and Vietnamese Americans, two of the largest ethnic groups, are of Han ethnicity. Perez and Hirschman (2009) note, for example:
The Chinese diaspora in many Asian countries has intermarried with other national-origin populations and is well represented in several immigrant streams from Southeast Asia, especially from the Philippines and Vietnam. We suspect that the Chinese/Japanese multiethnic population is a product of intermarriage among long-resident Asian populations in the United States…. The much higher report of 23 percent multiethnic composition among the small Malaysian American population undoubtedly reflects the tendency of many Malaysian Chinese to report their ethnicity (Chinese) and their country of origin (Malaysia)
Thus, for cultural and genetic reasons, one might expect slightly higher than predicted aptitudes from these groups, as Han Chinese generally exhibit superior performance. A more likely possibility is that many of Lynn and Vanhanen’s (2012) South East Asian scores are unreliable; either values were inferred (e.g., Cambodia and Burma) or they were based on small and unreliable samples (e.g., Laos and Vietnam). More recent analyses indicate that some of these estimated national aptitudes need to be revised (Malloy, 2014a; Malloy, 2014b).
To get better insight into the situation, we examined the performance of Asian subgroups (Chinese, Japanese, Koreans, Vietnamese, Asian Indians, Laotians, Cambodians, Other Asians, Hawaiians, Guamanians, Samoans, Other Pacific Islanders, and Filipinos) on California’s California Achievement Test. The data used was originally presented in Pang et al. (2011). The authors analyzed 5 years of results, from 2003 to 2008. We compared the various Asian-White d-values with ones derived from the National and Racial IQ scores presented by Lynn and Vanhanen (2012) and Lynn (2008). Table 15 below depicts the results. Column A lists the race/ethnicity, B the sample size, C the reading d-value relative to Whites, D the math d-value relative to Whites, E the average d-value relative to Whites, F Lynn’s estimated d-value, G the amount that Lynn’s global estimates under-predict U.S. Asian performance (column F minus column E). Since d-values were computed by subtracting the non-White ethnic group scores from the White score and dividing the difference by the White standard deviation, a negative d-value indicates that the non-White ethnic group scored higher than the White group. As can be seen, Pacific Islanders (Hawaiians, Guamanians, Samoans, and Other Pacific Islanders), Vietnamese, Asian Indians, and Filipinos performed substantially better than Lynn’s estimates would have predicted. Lynn estimates a Pacific Islander IQ 1 SD below the White mean, yet Pacific Islander Americans score about 0.5 below on the Californian CAT. Globally, Vietnamese, Asian Indians, and Filipinos are estimated to have national IQs, respectively, 0.40, 1.19, and 0.93 SD below the White mean and yet the Californian CAT differences between American Whites and American individuals of these nationalities is, respectively, – 0.13, -0.11, and 0.13.
Table 15: Asian/White Achievement Test Score Math and Reading Differences in California from 2003-2008

The Californian sample obviously was not nationally representative; this situation could introduce sampling error. For a more accurate estimate of the Pacific Islander American scores, we examined the nationally representative National Assessment of Educational Progress (NAEP) 2011 and 2013 reports. From 2011 on, the NAEP’s racial/ethnic taxonomy allows one to disaggregate non-Hispanic Pacific Islanders from non-Hispanic Asians. We computed d-values for racial and ethnic groups for 2011 and 2013 for grades 4, 8, and 12 for math and reading. The computations are presented in the supplementary file. As can be seen in Table 16, averaged across all samples, Pacific Islanders scored 0.52 standard deviations below Whites. This magnitude of difference is almost identical to that found between Whites and Pacific Islander on the California CAT. Thus, for this group at least, sampling does not seem to be an issue.
Table 16: U.S. 2011 and 2013 National Math and Reading Achievement Scores with Pacific Islanders

The analyses above point to the Asian sub-groups which are primarily behind the National IQ mis-prediction: Vietnamese, Asian Indians, and Filipinos, which, as of 2010, happen to be, respectively, the 4th, 3rd, and 2nd largest Asian American groups. This issue will have to be further explored in a future study. It should be noted that while National IQs greatly under-predict these Asian sub-group scores, they still predict Asian immigrant scores on average. For example, the regression plot in Figure 1 shows the relation between Lynn’s National IQs and the Asian subgroup CAT d-values from Table 15. This was significant at r (df = 10) = 0.75, p < 0.05 and rho (df = 10) = 0.59, p < 0.05.
Figure 1: CAT Achievement Quotient Versus Lynn’s Global IQs for Asian Subgroups in California

Replacing the Cambodian and Vietnamese National IQs with those proposed by Malloy (2014a) and (Malloy, 2014b) does not substantially change the results. It will be noticed that the within country difference is, on average, about half of that between countries. This agrees with the results of Fuerst and Kirkegaard (2014) and suggests that the transferability of National IQs is around 50%, meaning that, for example, a 20 point between nation difference is, on average, associated with a 10 point between diaspora within nation difference.
As for the rank order relation among Asian ethnicities, the Californian CAT results roughly agree with ones based on national surveys. Table 17 presents d-values, relative to either Chinese or North East Asians, for achievement or SAT tests based on the scores of the individuals who participated in the National Education Longitudinal Study of 1988 (NELS:88), the Education Longitudinal Study of 2002 (ELS:2002), and The Early Childhood Longitudinal Study, Kindergarten Class of 1998-99 (ECLS-K). As with the tables above, positive d-values mean lower scores relative to the reference. In these surveys, N.E. Asians performed about 0.5 standard deviations better than S.E. and Other Asians.
Table 17: Asian Subgroup Performance Based on Three National Samples

Based on the scores discussed in tables 15 to 17, it is clear that there is significant between group variation within the broad Asian category. For example, the difference between North East Asian and Pacific Islander Americans approaches 1 standard deviation.
Summary
We conducted a cross generational exploratory meta-analysis of the magnitude of aptitude differences between sociologically defined racial and ethnic groups in the U.S. Our analysis led to a number of questions which will need to be answered with future research. These include:
(1) Is there a nation of origin effect for first generation White immigrants?
(2) Are Black first generation immigrant cognitively selected?
(3) Is there a region of origin effect (African versus West Indies) for Black immigrants?
(4) What accounts for the first to second generation Black aptitude difference?
(4) To what extent do first generation Hispanic scores suffer from psychometric bias?
(5) What accounts for the first to second generation Hispanic aptitude difference?
(6) How does genetic and cultural assimilation affect Hispanic scores across generations? (7) What accounts for the higher than predicted (by national IQs) Asian performance?
Such topics will have to be explored using alternative data sets.
Acknowledgements: I wanted to thank Meng Hu for his dedicated help checking over the statistics and reorganizing the supplementary files.
References
Byun, S. Y., & Park, H. (2012). The Academic Success of East Asian American Youth The Role of Shadow Education. Sociology of education, 85(1), 40-60.
Capps, R., McCabe, K., & Fix, M. (2012). Diverse streams: African migration to the United States. Migration Policy Institute: Washington, DC.
Corwyn, R. F., & Bradley, R. H. (2008). The panethnic Asian label and predictors of eighth-grade student achievement. School Psychology Quarterly,23(1), 90.
Duncan, B., & Trejo, S. J. (2011). Tracking intergenerational progress for immigrant groups: The problem of ethnic attrition. The American Economic Review, 101(3), 603-608.
Easterly, W., & Nyarko, Y. (2008). Is the brain drain good for Africa?. Brookings Institution, Global Economy and Development.
Ennis, S. R., Ríos-Vargas, M., & Albert, N. G. (2011). The hispanic population: 2010. US Department of Commerce, Economics and Statistics Administration, US Census Bureau.
Feliciano, C. (2005). Educational selectivity in US immigration: how do immigrants compare to those left behind?. Demography, 42(1), 131-152.
Fuerst, J. (2013, April, 18). The Aptitude of Jews and Gentiles at Selective Universities in the US. Accessed at: https://humanvarieties.org/2013/04/18/the-aptitude-of-jews-and-gentiles-at-selective-universities-in-the-us-and-some-other-stuff/
Fuerst, J., & Kirkegaard, E. O. Do National IQs Predict US Immigrant Cognitive Ability and Outcomes? An Analysis of the National Longitudinal Survey of Freshman.
Gibson, M. A., & Ogbu, J. U. (1991). Minority status and schooling: A comparative study of immigrant and involuntary minorities. Garland Publishing, Inc., 717 Fifth Avenue, Suite 2500, New York, NY 10022.
Hansen, J., Liu, X., & Kučera, M. (2010). Educational attainment of children of immigrants: Evidence from two cohorts of American youths.
Hoeffel, E. M., Rastogi, S., Kim, M. O., & Hasan, S. (2012). The Asian Population: 2010. US Department of Commerce, Economics and Statistics Administration, US Census Bureau.
Kaestner, R., & Malamud, O. (2010). Self-selection and international migration: New evidence from Mexico (No. w15765). National Bureau of Economic Research.
Lynn, R. (2008). The global bell curve. Augusta, GA: Washington Summit Books.
Lynn, R., & Vanhanen, T. (2012). Intelligence: A unifying construct for the social sciences. Ulster Institute for Social Research.
Malloy, J. (2014a, June, 6). HVIQ Burma. Accessed at: https://humanvarieties.org/2014/06/06/hvgiq-burma/
Malloy, J. (2014b, June, 19). HVIQ Vietnam. Accessed at: https://humanvarieties.org/2014/06/19/hvgiq-vietnam/
Model, S. (2008). West Indian immigrants: A black success story?. Russell Sage Foundation.
Pang, V. O., Han, P. P., & Pang, J. M. (2011). Asian American and Pacific Islander Students Equity and the Achievement Gap. Educational Researcher,40(8), 378-389.
Perez, A. D., & Hirschman, C. (2009). The changing racial and ethnic composition of the US population: Emerging American identities. Population and Development Review, 35(1), 1-51.
Richwine, J. (2009). IQ and immigration policy (Doctoral dissertation, Harvard University).
Rindermann, H. (2013). African cognitive ability: Research, results, divergences and recommendations. Personality and Individual Differences, 55(3), 229-233.
Roth, P. L., Bevier, C. A., Bobko, P., Switzer, F. S., & Tyler, P. (2001). Ethnic group differences in cognitive ability in employment and educational settings: A meta-analysis. Personnel Psychology, 54(2), 297-330.
Trundt, K. M. (2013). Construct Bias in the Differential Ability Scales, Second Edition (DAS-II): A comparison among African American, Asian, Hispanic, and White Ethnic Groups. Unpublished doctoral dissertation, University of Texas, Austin, TX.
Yang, L. (2013). Educational Achievement Among Asian Children: Ethnic Differences in First Grade Math and Reading Scores. McNair Scholars Research Journal, 9(1), 16.
Discover more from Human Varieties
Subscribe to get the latest posts sent to your email.

“Simply put, Asians have a high rate of exogamy, the out-mating is assortative with respect to indices of human capital (with exogamy associated with lower human capital), and self ethnic identification is conditioned, in part, by parental ethnic identification. The joint effect of these three factors is a selective ethnic attrition with respect to human capital which magnifies across generations. In short, third+ generation self identifying Asians represent a positively selected remnant of a larger genealogically defined population (Chiswick and Houseworth, 2011; Duncan and Trejo, 2012).”
I think your sources do not support this. Mixed descendents of non-Indian Asians have an Asian-bias in racial identification. Therefore, later generations of Asians tend to be more mixed. Mixed descendents of non-Filipino Asians who identify as Asian have more educated parents than those who identify as non-Asian, but they also tend to have more Asian ancestry, and Asians are better educated than non-Asians. Thus, the data could suggest that Asians who engage in exogamy are somewhat representative of other Asians. Either way, they are still mixed, and their act of identification doesn’t affect the Asians who did not mix or necessarily affect the act of identification in future generations. Your suggestion that the effect of exogamy is magnified across generations also doesn’t take into account the transition of white-Asian exogamy from “war brides” to modern cosmopolitan professionals who decide to intermarry, which is supported by Census data. Chiswick and Houseworth claim that, in general, intermarriage of Americans is more common both with more education and with greater educational disparity between oneself and one’s racial group. Since two-thirds of Asian Americans are immigrants, it’s also possible that whatever cultural factors affected current third-generation Asian Americans will be overwhelmed by the current nature of immigration and cultural factors overseas.
The point was: (1) there is assortative mating between groups, (2) Asians tend to have higher human capital than other groups, (3) because of this, lower human capital Asians will disproportionately out-mate, (4) the offspring of these out matings will tend to be classified as mixed race and so excluded from the mono-race categories used in the survey, (5) the remaining mono-race Asian individuals will then represent a select group with respect to human capital.
What do you disagree with?
[Here were SAT and parental education scores for 2nd and 3rd+ generation Asians:
https://humanvarieties.org/?attachment_id=3574
For the first score (race: Asian), “Asians” are inclusively defined. For the second (Race/ethnicity with multiples), mixed race individuals are excluded from the “Asian” group. You see that by the third generation mixed race Asians do worse than full race ones. I would guess that some of this is due to assortative outmating.]
I don’t doubt that mixed people tend to score between the original groups. I do question whether “lower human capital Asians will disproportionately out-mate.” At least, the sources you originally cited didn’t show that. I question whether findings that pertain to current 3rd-generation Asian Americans can be extrapolated to future 3rd-generation Asian Americans. 3rd-generation Asian Americans are a tiny minority within a small minority. This is the first I have heard that they do well. The sample sizes tend to be small, but TIMSS and apparently some research that I can’t currently access suggest that 3rd-generation Asian Americans do not perform as well. I think racial differences could be genetic, but the differences between whites and Asians could be small enough that environmental factors involved with immigration, acculturation, and acceptance of intermarriage might matter more. What is the sample size of your SAT data? My blog has been graphing huge changes in Asian SAT scores over the decades for foreign Asians and Asian Americans.
I removed the last paragraph, since offered was a poor explanation either way — what needs to be explained is why the cognitive scores of 1st-3rd+ generation Asians is well above what one would expect given national IQs. Do you have any ideas (aside from those noted)? As for the claim that “the sources you originally cited didn’t show that” “lower human capital Asians will disproportionately out-mate”, I actually cited the authors in support of the claim that “third+ generation self identifying Asians represent a positively selected remnant of a larger genealogically defined population.” Whether or not the authors’ data supports this, the authors themselves agree, stating: “By the third generation however, intermarriage and assimilation complicate ethnic identifications … because large, national surveys almost never provide information on the countries of birth of an adult respondent’s grandparents, studies of immigrants beyond the second generation typically have little choice to but to employ “subjective” measures of ethnic identification rather than arguably more “objective” measures based on countries of birth of the respondent and his ancestors…..Perhaps even more interesting is how the selection of ethnic attrition varies across groups. …For all Asian groups except Filipinos, however, the selectivity runs in the opposite direction….”
The authors cite as a possible explanatory model that of Delia Furtado (2006), which discusses between ethnic assortative mating on education. There is a wider body of literature that supports Furtado (2006)’s model, but I didn’t care to discuss it since this was only a passing note. I’m half tempted to look to see if lower education/IQ, in fact, predicts out mating among Asians. But I’m not really interested in the issue. If you really want, though, I will check GSS/Add Health/NLSY to confirm. As for the other points, I agree that the sample sizes are tiny. That’s why I had a bunch of missing data points and why the scores bounced around. Regrading the SAT data, the program didn’t allow direct computations; if one plays around one can get them only because there’s a bug in the online program. Generally, the overall sample size was about 100,000 — so multiply this by the percent of the population that 3rd+ gen Asians make up and x by maybe 0.8 for missing responses (for the variables in question).
“what needs to be explained is why the cognitive scores of 1st-3rd+ generation Asians is well above what one would expect given national IQs. Do you have any ideas”
I read most of Richard Lynn’s work on the Flynn effect in Asia. (In general, I think you are much more familiar with IQ research than I.) It seems like a lot of the really rapid IQ gains in Asia happened in the mid-20th century. The lack of recent big gains in China and Taiwan could be due to timing, but foreign student SAT scores and Asian-American SAT scores are rising a lot right now. My point is that these changes might have something to do with other inconsistencies, such as the one you noted, but I’m not sure.
“Whether or not the authors’ data supports this, the authors themselves agree”
I don’t think they went as far as you did. They seem to equate non-Asian racial identification with “ethnic attrition,” but since it looks like they didn’t control those numbers for the number of “grandparents born in country,” the child just seems to be determining identification by the amount of Asian ancestry, which is understandable and fits with the Asian parents being better educated than white parents, even if they engage in exogamy.
“The authors cite as a possible explanatory model that of Delia Furtado”
Thanks. I glanced at that study. It mentions a couple of contradicting findings from two studies about Asians. Then, it shows evidence of assortative mating affecting endogamy rates among different European immigrant groups.
“If you really want, though, I will check GSS/Add Health/NLSY to confirm.”
That’s not necessary, but it is an interesting issue to me. I don’t know what the answer is, but it seems to me that assortative mating can be present without fitting Delia Furtado’s model. For instance, whites could be affected more in raw numbers than Asians. Very well educated whites could have much higher exogamy rates with Asians. That way, Asian SES demographics can remain stable even with heavy attrition. The white population is much larger, so its SES demographics will also seem stable. Even if Asians are better educated, I think being educationally above the average of one’s group creates a certain kind of mobility and removal from one’s immediately surrounding community. Asian men with higher SES are better able to overcome the anti-Asian bias that white women tend to have, and I can think of anecdotal evidence that many educated Asian women marry white men.
“the overall sample size was about 100,000”
That leaves about 4,800 Asians, of whom about 1,600 are not 1st-generation. I’m guessing that about 500 are 3rd+ generation. That’s not a lot, but I bet it’s better than TIMSS.
I find the breakout of Hispanics very unsatisfactory (Mexican, Cuban, Puerto Rican, etc). The Mexican immigrants are by and large mestizo and Indio; a large portion of the Cubans are white; and a majority of the Puerto Ricans are black with little white admixture. This has got to confound the analysis severely. Especially when you consider that white Cubans have been very successful in the US (their ancestors fleeing Castro were over-represented by middle and upper class professionals) and if not fully assimilated to white culture very comfortable in it.
… and a majority of the Puerto Ricans are black with little white admixture.
This is extremely inaccurate. Genetic studies of Puerto Rican Americans put them between 53-62% white and 23-29% black.
A number of the surveys which I employed allowed one to decompose Hispanics by self reported race (Black, White, Amerindian) and nationality (Mexican, Cuban, Puerto Rican). The national differences were small and I judged that, in this instance, self reported race was unreliable. As such, I didn’t include these sub-analyses. However, I do have the data on hand, if you are interested in writing up a brief post…
You say:
I would suspect that African migrant IQ is substantially higher than the source population, and probably even somewhat higher than the IQ of West Indian black migrants, due to the difficulty of getting from Africa to the U.S. However, the African migrant population probably also has a higher IQ than the genetic potential of their source population, which would suggest that the second generation of African migrants would have a lower IQ than their parents.
I can’t understand what you’re saying. It sounds like you’re discussing regression to the mean. The problem is that that’s complicated. Immigrants wouldn’t be selected on IQ scores; they would be selected on true g, the predictive backbone of IQ. This selection would likely filter out much of the random variance i.e. due to error/ non-shared factors which is generally not on g. Thus, if immigrants were so selected, there would be little regression, because they would be selected mostly on the aspect of IQ which is transmittable and predictive.