According to Spearman’s hypothesis, the magnitude of the black-white gap on a given cognitive ability test is primarily determined by the test’s g loading. Tests that are better measures of g are associated with larger gaps.
The Differential Ability Scales, Second Edition, or the DAS-II, is an IQ test for assessing children and adolescents. It comprises a total of 21 subtests, although in the present analysis only 13 subtests are used, because not all tests are administered across age groups. I will use the method of correlated vectors (MCV) to test whether g loadings are correlated with mean racial differences on the DAS-II subtests. In addition to the black-white gap, I will also investigate if the test performance of Asians and Hispanics is predicted by g loadings.
Data
Trundt’s dissertation (2013) reports the means and SDs for whites, blacks, Hispanics, and Asians from the DAS-II standardization sample. The demographic characteristics of the sample looked like this:

Subtest means and SDs were as follows:

For more information on the subtests, see here.
The next table shows the sizes of the racial/ethnic gaps, using pooled SDs, with the results from the two white samples averaged. A stands for Asians, H for Hispanics, and so on, and if the difference is positive, the first-mentioned group in the pair outscored the second-mentioned group, and vice versa.

The general pattern of mean differences on the subtests is a familiar one: Asians outscore whites, whites outscore Hispanics, and Hispanics outscore blacks.
The g loadings of the DAS-II subtests were not reported by Trundt, so I used those computed in Keith et al. (2010), which reports a higher-order factor analysis of the same standardization sample:
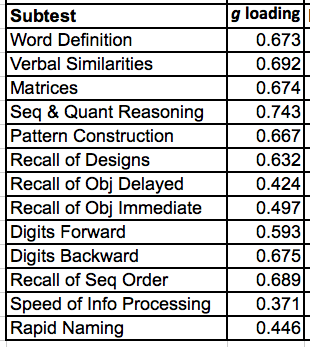
These g loadings are for the entire sample, undifferentiated by race or ethnicity, whereas it is recommended that in MCV analyses g loadings be computed separately for each group. However, these data have been tested for measurement invariance between the four groups under discussion, and it was found that the loadings can be constrained to be equal across groups without a significant deterioration in model fit. This point will be further discussed later.
Results
The results of the MCV analysis of the racial/ethnic gaps are presented in the table below. The table shows Pearson’s r and Spearman’s rho correlations between the vectors of g loadings and subtest differences. P values are reported for the Spearman correlations, as recommended in Nyborg & Jensen (2000). The corrected Pearson’s r‘s were obtained by partialling out the square roots of the reliability coefficients (Cronbach’s alphas) of the subtests (I couldn’t find a reliability coefficient for the Recall of Objects, Delayed test, so I used the average reliability of all subtests for it).

It can be seen that the Asian-black, Asian-Hispanic, white-black, and white-Hispanic gaps are moderately strongly correlated with the g loadings, and the correlations are significant at the 0.05 or 0.01 level. In contrast, the Hispanic-black and Asian-white gaps are only weakly correlated with the g loadings, and the correlations are not significant. Correcting for unreliability has no substantial effect on these results.
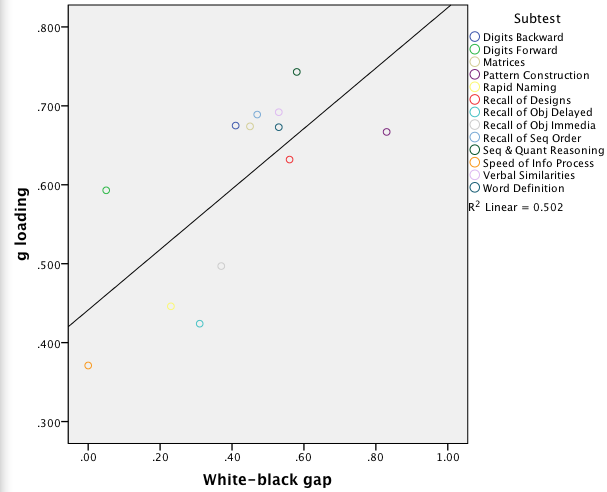
As an illustration, below is a graph showing the correlation between the g loadings and white-black differences on the DAS-II subtests:
And here’s the graph from the Asian-white analysis:

Click on the links for other graphs: Asian-Hispanic, Asian-black, white-Hispanic, Hispanic-black.
The most straightforward interpretation of these results is that the Asian and white superiority vis-a-vis the blacks and the Hispanics is primarily due to g differences. In contrast, the fact that Asians outscore whites may mainly reflect non-g differences, and the same explanation may hold for the Hispanic-black gap.
Discussion
Using the method of correlated vectors to analyze a large number of samples, Jensen found an average correlation of 0.62 between the size of the black-white gap and g loadings (Nyborg & Jensen [2000]). This study replicated that robust finding, and showed that the same pattern of results obtained for Asian-black, Asian-Hispanic, and white-Hispanic differences, too.
The MCV is not a highly reliable method, and it sometimes produces misleading results. The present investigation yielded quite “clean” results in support of Spearman’s hypothesis. This may reflect the facts that the DAS-II is a carefully developed test, the g loadings used were from a well-fitting higher-order model, and the sampling of individuals from different races was satisfactory, too. A limitation in this analysis was that there was not a great deal of variation in the g loadings, with many of them bunching together in the 0.65-0.70 range.
If g is not the main explanation of black-Hispanic and Asian-white differences, what then is? Language problems are unlikely to be the culprit, because measurement invariance was not violated across these samples. I would say that differences in visual processing (Gv in the CHC taxonomy) may explain a substantial amount of the gaps in both cases, although I have looked into this only very cursorily. Moreover, blacks appear to be slightly superior to Hispanics on simple memory tests and speed tests.
In her dissertation, Trundt established that measurement invariance holds across the white, black, Asian, and Hispanic samples in the DAS-II. This means that the same ability differences that explain within-group test score differences explain also the between-group test score differences. The DAS-II is an unbiased measure of the abilities that it calls for. The only exception to this was a marginal finding that the Digit Span Forward test may be somewhat biased in favor of blacks compared to whites when it is used as a measure of short-term memory.
Trundt’s measurement invariance investigation was based on a factor model where the correlations between subtests are explained by six correlated factors. She did not use a model where the correlations among the factors are explained by a higher-order g factor, and thus her study does not directly prove that the DAS-II is an unbiased measure of g regardless of race. However, the study by Keith et al. (2010) showed that a higher-order g model fits the DAS-II well, suggesting that had Trundt included g in her analysis, the results would likely not have been different.
References
Keith et al. (2010). Higher-order factor structure of the Differential Ability Scales-II: Consistency Across Ages 4 to 17. Psychology in the Schools, 47(7), 676-697.
Nyborg, H., & Jensen, A.R. (2000). Black-white differences on various psychometric tests: Spearman’s hypothesis tested on American armed services veterans. Personality and Individual Differences, 28, 593-599.
Trundt, Katherine Marie (2013). Construct Bias in the Differential Ability Scales, Second Edition (DAS-II): A comparison among African American, Asian, Hispanic, and White Ethnic Groups.

I have a question about regression to the mean. If a man has an IQ of 140 and he marries a woman with an IQ of 90, what will be the IQ of their son/daughter, assuming a mean heritability of 0.6 for mother and father? Does anyone know the equation to calculate this? If so, what is it and how is it done? Thanks in advance.
The parental midpoint is 115, i.e., +15 points from the mean, so the expected offspring IQ is 100+0.6*15=109, assuming additive heritability. See here and here for more.
Why would you use the heritability when making the prediction instead of the square root of it? Aren’t predictions made based on R values as opposed to using explained variance to make the prediction?
In many contexts, the square root of heritability would be the right statistic to use, but when predicting offspring phenotypes from midparent phenotypes, heritability is the correct quantity. I explained the logic behind the breeder’s equation here.
If we have a population of 40 million people with an average IQ of 85 and an average standard deviation of 12.5, how would we go about calculating the percentage of the population that has an IQ over 130?
Were you dealing with a truly normal curve, first, you would divide the difference by the standard deviation to derive the standardized difference or z score — in this case, ((130-85)/12.5) = 3.6; second, you would use a one tail z score to percentile calculator to derive the percentile at or above the z-score. For IQ, the tails are fat, though, so that should be taken into account, too.
D, What was the B/W FSIQ d?
Don’t know. Full-scale scores weren’t reported by Trundt.
I tried calculating the percentage of people with a 130 IQ assuming a mean IQ of 70 and a standard deviation (SD) of 30, and ended up with a percentile of 2.275, which is a lot higher than for a population with a mean IQ of 85 and an SD of 12.5, which would be 0.0159. This has to be incorrect. How does one deal with SD’s over 15?
I’ve heard it argued that a normally distributed IQ with a mean of 70 would not overlap on the right side of the distribution of another normally distributed IQ with a mean of 100. This would be purely a function of the mean and SD of both distributions. They would, however, overlap on the left side of the distribution. Is there any truth to this?