Some variables in the Add Health and the NLSY97 allow us to investigate the relationship of skin color with IQ and racial ancestry with IQ (AHPVT scores and ASVAB scores) among the US black population. Given the positive results, a question worth considering is whether or not skin color mediate the relationship between family ancestry and IQ.
Previously, the results from the Add Health have been reported elsewhere. But I think it would be better to have another look at it. If you want to replicate the present finding, you need SPSS and the Add Health public data. I explain the steps below [1], [2].
The first table below shows the (weighted) mean AHPVT score of US born blacks by racial ancestry, as reported by the respondents. The second table shows the difference in AHPVT scores for blacks by skin color, as reported by the interviewers. Go here for the unweighted result, which displays the real sample size (N). Going to Data, Weight Cases by, the (Wave 1) variable used is : GRAND SAMPLE WEIGHT-W1 [GSWGT1]. In both tables, the difference in scores is not trivial. By way of comparison, the weighted AHPVT scores for whites [3] are 105.10 (N = 2230) and 105.71 (N = 2187) using WHITE_ANCESTRY as the dependent variable.

For doing this, go to Analyze, Compare Means, Means. Put the AHPVT scores in Dependent list. And the skin color and WHITE_ANCESTRY variables in Independent list (both in Box 1, or Layer 1).
CROSS-SECTIONAL STANDARDIZED SCORE-W3 [PVTSTD3C]
CROSS-SECT/LONG PVT STANDRDIZED SCORE-W1 [PVTSTD1]
S35Q17 RESPONDENT SKIN COLOR-W3 [H3IR17]
And here is the result from the linear regression (N = 421). Now, for doing this, put your skin color and ancestry independent variables in Box 1 (or Layer 1), and the parental education variable (Wave 1 variable, PA12) in Box 2. Finally, put the PVTSTD3C variable in the ‘Dependent’ box.

Model 1 shows the independent effects of skin color and white ancestry on IQ. The standardized betas, as well as the partial and part correlations, show the contribution of those independent variables when the other variables entered in the model are held constant.
Some reminders. The zero-order is just a bivariate correlation. The partial correlation coefficient, in fact, is the correlation between the dependent variable Y and the independent variable X1 when the effect of X2 (say, the covariate) on both X1 and Y has been removed. In contrast, the part correlation (or semi-partial correlation) is the correlation between the dependent Y and the independent X1 when the effect of X2 on either X1 or Y has been removed [4].
That being said, the sign. column shows the p-values. They are all significant at the 5% level, except for skin color in Model 2. Regarding the t-statistics, this is just another way to calculate the p-value, by simply dividing the unstandardized B by its standard error.
From the above table, it is clear that skin color does not mediate the IQ-ancestry correlation, but ancestry does not mediate IQ-skin correlation either. They seem to have independent effects. The same pattern is displayed in the NLSY97 (below).
Model 2 is interesting in that the parental education has been added. We can see that the beta weights and partial correlations for skin color are considerably reduced and are no longer significant at the 5% level. When an additional variable such as H4ED2 S9Q2 HIGHEST EDU LVL ACHIEVED TO DATE-W4, is entered as independent variable, the standardized coefficient for skin color falls even further (N = 420, β = 0.033, p = 0.451).

Even if the influence of parental education on verbal IQ is not affected by the inclusion of the other variables, it is not, contrary to what Hill has once claimed (2002) in response to Lynn (2002a), and to which Lynn has replied (2002b). Controlling for parent’s education or income is like controlling for IQ, or more broadly, genetic characteristics.
There is something Lynn (2002b) doesn’t seem to have noticed however. The fact that the relationship between skin color and IQ has fallen after the inclusion of education and other variables is exactly what the genetic hypothesis would have predicted. It is not the skin color per se that drives the IQ level, but here the degree of ancestry which is tied to IQ. Controlling for education is like controlling for the variables that were initially causing education levels to vary. In other words, the explanatory variables such as IQ. That the influence of racial admixture diminished after the inclusion of SES is, perhaps counterintuitively, consistent with a genetic hypothesis. As I explained elsewhere, matching for SES does not make any sense. Indeed, if the link between skin color and IQ still remains, it would mean that skin color is linked to IQ when the degree of ancestry has been controlled. In this case, something that is tied to skin color but not to the degree of ancestry is causing IQ to vary. But the existence of an IQ-skin correlation (net of admixture effect) does not imply that differences in color cause the differences in IQ. Instead, this means that some characteristics related to skin color are causing differences in IQ (see below).
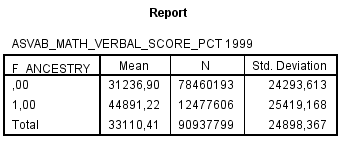
We now move on to the NLSY97 data [5] [6] [7]. Here is a table showing the weighted mean ASVAB scores for US born blacks by racial ancestry (1,00 = again, this specifies those who reported having a white in their family). For the unweighted scores, go here (Go to Data, Weight Cases, by : R12362.01 SAMPLING_PANEL_WEIGHT). The gap is substantial : about 0.537 SD (or 0.537 x 15 = 8 IQ points). By way of comparison, the weighted ASVAB score for non-hispanic whites is 57826,55 (Std. Dev. : 27183,794) which means that whites are 0.49 SD (or, 0.49 x 15 = 7.35 IQ points) higher than blacks who report having whites in their family.
Next is the result from the linear regression (N = 538).

Although the IQ-skin and IQ-ancestry correlations are somewhat lower in the NLSY97, the influence of ancestry is not mediated by skin color and is, once again, stronger than the effect of skin color. In Model 2, the influence of skin color is not reduced further after the inclusion of parental education. But adding parental income variable seems to have more impact (N = 428).

Just in case, I also checked the assumption of normal distribution. The histogram, P-Plot and scatterplot do not display any serious departure from normality, both in Add Health and NLSY97. More important is the casewise diagnostics. I saved the residuals for Cook’s D, Mahalanobis D, and Centered Leverage. Go to Analyze, Reports, Case Summaries, and put your variables MAH_1, COO_1, LEV_1, in “Variables” box. Also check “Show case numbers”. The influence statistics for the listed cases in the Case Summaries table do not display any Cook’s Distance value greater than 1 or even 4/n (where n is the sample size). This means that the outliers do not affect significantly the results.
I also tried to correlate (bivariate) my ancestry variable with skin color, among the black population as always. Strangely, the correlation is weaker than what I have expected : Pearson r = 0.256 (unweighted) and 0.163 (weighted), Spearman rho = 0.244 (unweighted) and 0.141 (weighted) for Add Health, Pearson r = -0.202 (unweighted) and -0.245 (weighted) and Spearman rho = -0.185 (unweighted) and -0.209 (weighted) for NLSY97. The skin-ancestry correlations were thus considerably lower than what have been reported by Parra et al. (2004, Table 1). The skin color report might be biased by measurement errors and the ancestry report being imperfect, as people could not have been able to remember interbreeding in remote times. Anyway, this provides an explanation why ancestry does not mediate skin color as much as I expected.
Overall, the above finding is not surprising for those who have read The Bell Curve (1994, pp. 319-325). When IQ is held constant, the probability of having a college degree, being in a high-IQ occupation, is higher for blacks. Also, the black-white wage gap is reduced to nothing when IQ has been taken into account. Surely, this would not have happened if discrimination was based on skin color.
We know that lighter skinned blacks (Hochschild and Weaver, 2007, Figure 1) have a higher socio-economic status. Thus, the finding that the B-W IQ gap grows with SES levels (Jensen, 1973, p. 241, 1980, p. 44; Herrnstein & Murray, 1994, p. 288) goes against colorism because this means that, compared to low-SES blacks, the high-SES blacks (presumably less discriminated against) are more disadvantaged relative to whites of same background.
A point should be kept in mind. Even if the influence of the ancestral index on IQ was reduced after controlling for the effect of skin color, it does not constitute an argument for colorism. Over and above the fact that variance in skin color might be due to causes unrelated to racial admixture if it is a socially valued characteristic (e.g., assortative mating; Jensen, 1973, p. 223), skin color (as well as SES) has some genetic components that are correlated with the ancestral index.
The present finding is not in line with the colorism hypothesis because it predicts that skin color based discrimination is all about appearance, and that such discrimination still occurs above and beyond skills and social background. Further evidence against colorism is provided in a subsequent analysis.
Notes :
[1] Go here to download the public data (documentation and codebook are in the datafiles). You need the following :
DS1: Wave I, Public Use Data
DS2: Wave I, Grand Sample Weights, Public Use Data
DS4: Wave III, Peabody Picture Vocabulary Test Score Data, Public Use
DS12: Wave III, Public In-Home Questionnaire
DS23: Wave IV, Public Use Data
Then, you have to combine those waves. See examples here, and there.
[2] Open your Syntax Editor page. Go to File, New, Syntax, and copy/paste the following. Then, click on Run, All. This will add new variables in the bottom of the Data Editor page.
Compute Family1EA=0.
If H3OD7A=3 or H3OD7A=9 or H3OD7A=11 or H3OD7A=12 or H3OD7A=22 or H3OD7A=27 or H3OD7A=35 or H3OD7A=36 or H3OD7A=37 or H3OD7A=43 or H3OD7A=47 or H3OD7A=48 or H3OD7A=49 or H3OD7A=51 or H3OD7A=52 or H3OD7A=59 or H3OD7A=79 or H3OD7A=88 or H3OD7A=94 or H3OD7A=103 or H3OD7A=104 or H3OD7A=105 or H3OD7A=106 or H3OD7A=108 or H3OD7A=112 or H3OD7A=117 or H3OD7A=124 or H3OD7A=125 or H3OD7A=135 or H3OD7A=140 or H3OD7A=143 or H3OD7A=452 or H3OD7A=453 or H3OD7A=455 or H3OD7A=463 or H3OD7A=468 Family1EA=1.
Compute Family2EA=0.
If H3OD7B=3 or H3OD7B=9 or H3OD7B=11 or H3OD7B=12 or H3OD7B=22 or H3OD7B=27 or H3OD7B=35 or H3OD7B=36 or H3OD7B=37 or H3OD7B=43 or H3OD7B=47 or H3OD7B=48 or H3OD7B=49 or H3OD7B=51 or H3OD7B=52 or H3OD7B=59 or H3OD7B=79 or H3OD7B=88 or H3OD7B=94 or H3OD7B=103 or H3OD7B=104 or H3OD7B=105 or H3OD7B=106 or H3OD7B=108 or H3OD7B=112 or H3OD7B=117 or H3OD7B=124 or H3OD7B=125 or H3OD7B=135 or H3OD7B=140 or H3OD7B=143 or H3OD7B=452 or H3OD7B=453 or H3OD7B=455 or H3OD7B=463 or H3OD7B=468 Family2EA=1.
Compute Family3EA=0.
If H3OD7C=3 or H3OD7C=9 or H3OD7C=11 or H3OD7C=12 or H3OD7C=22 or H3OD7C=27 or H3OD7C=35 or H3OD7C=36 or H3OD7C=37 or H3OD7C=43 or H3OD7C=47 or H3OD7C=48 or H3OD7C=49 or H3OD7C=51 or H3OD7C=52 or H3OD7C=59 or H3OD7C=79 or H3OD7C=88 or H3OD7C=94 or H3OD7C=103 or H3OD7C=104 or H3OD7C=105 or H3OD7C=106 or H3OD7C=108 or H3OD7C=112 or H3OD7C=117 or H3OD7C =124 or H3OD7C=125 or H3OD7C=135 or H3OD7C=140 or H3OD7C=143 or H3OD7C=452 or H3OD7C=453 or H3OD7C=455 or H3OD7C=463 or H3OD7C=468 Family3EA=1.
Compute Family4EA=0.
If H3OD7D=3 or H3OD7D=9 or H3OD7D=11 or H3OD7D=12 or H3OD7D=22 or H3OD7D=27 or H3OD7D=35 or H3OD7D=36 or H3OD7D=37 or H3OD7D=43 or H3OD7D=47 or H3OD7D=48 or H3OD7D=49 or H3OD7D=51 or H3OD7D=52 or H3OD7D=59 or H3OD7D=79 or H3OD7D=88 or H3OD7D=94 or H3OD7D=103 or H3OD7D=104 or H3OD7D=105 or H3OD7D=106 or H3OD7D=108 or H3OD7D=112 or H3OD7D=117 or H3OD7D=124 or H3OD7D=125 or H3OD7D=135 or H3OD7D=140 or H3OD7D=143 or H3OD7D=452 or H3OD7D=453 or H3OD7D=455 or H3OD7D=463 or H3OD7D=468 Family4EA=1.
Compute FamilyEA =0.
If Family1EA =1 or Family2EA =1 or Family3EA =1 or Family4EA =1 FamilyEA =1.
Count NFamilyEA = Family1EA to Family4EA (1 thru 1).
Compute Family1AC=0.
If H3OD7A=2 or H3OD7A=14 or H3OD7A=16 or H3OD7A=33 or H3OD7A=39 or H3OD7A=56 or H3OD7A=68 or H3OD7A=92 or H3OD7A=131 or H3OD7A=134 or H3OD7A=300 or H3OD7A=406 or H3OD7A=408 or H3OD7A=414 Family1AC=1.
Compute Family2AC=0.
If H3OD7B=2 or H3OD7B=14 or H3OD7B=16 or H3OD7B=33 or H3OD7B=39 or H3OD7B=56 or H3OD7B=68 or H3OD7B=92 or H3OD7B=131 or H3OD7B=134 or H3OD7B=300 or H3OD7B=406 or H3OD7B=408 or H3OD7B=414 Family2AC=1.
Compute Family3AC=0.
If H3OD7C=2 or H3OD7C=14 or H3OD7C=16 or H3OD7C=33 or H3OD7C=39 or H3OD7C=56 or H3OD7C=68 or H3OD7C=92 or H3OD7C=131 or H3OD7C=134 or H3OD7C=300 or H3OD7C=406 or H3OD7C=408 or H3OD7C=414 Family3AC=1.
Compute Family4AC=0.
If H3OD7D=2 or H3OD7D=14 or H3OD7D=16 or H3OD7D=33 or H3OD7D=39 or H3OD7D=56 or H3OD7D=68 or H3OD7D=92 or H3OD7D=131 or H3OD7D=134 or H3OD7D=300 or H3OD7D=406 or H3OD7D=408 or H3OD7D=414 Family4AC=1.
Compute FamilyAC=0.
If Family1AC=1 or Family2AC=1 or Family3AC=1 or Family4AC=1 FamilyAC=1.
Count NFamilyAC = Family1AC to Family4AC (1 thru 1).
IF FamilyAC=1 WHITE_ANCESTRY=0.
IF FamilyEA=1 WHITE_ANCESTRY=1.
USE ALL.
COMPUTE filter_$=(H1GI6B=1 and H3OD4B=1 and H3IR4=2 and H4IR4=2 and H3OD13=1).
VARIABLE LABELS filter_$ ‘H1GI6B=1 and H3OD4B=1 and H3IR4=2 and H4IR4=2 and H3OD13=1 (FILTER)’.
VALUE LABELS filter_$ 0 ‘Not Selected’ 1 ‘Selected’.
FORMATS filter_$ (f1.0).
FILTER BY filter_$.
EXECUTE.
COMPUTE ScaledWeights1 = (GSWGT1*421/891714).
EXECUTE.
WEIGHT BY ScaledWeights1.
REGRESSION
/DESCRIPTIVES MEAN STDDEV CORR SIG N
/MISSING LISTWISE
/STATISTICS COEFF OUTS BCOV R ANOVA CHANGE ZPP
/CRITERIA=PIN(.05) POUT(.10)
/NOORIGIN
/DEPENDENT PVTSTD3C
/METHOD=ENTER H3IR17 WHITE_ANCESTRY
/METHOD=ENTER PA12
/PARTIALPLOT ALL
/SCATTERPLOT=(*ZRESID ,*ZPRED)
/RESIDUALS DURBIN HISTOGRAM(ZRESID) NORMPROB(ZRESID)
/CASEWISE PLOT(ZRESID) OUTLIERS(3).
COMPUTE ScaledWeights2 = (GSWGT1*420/889164).
EXECUTE.
WEIGHT BY ScaledWeights2.
REGRESSION
/DESCRIPTIVES MEAN STDDEV CORR SIG N
/MISSING LISTWISE
/STATISTICS COEFF OUTS BCOV R ANOVA CHANGE ZPP
/CRITERIA=PIN(.05) POUT(.10)
/NOORIGIN
/DEPENDENT PVTSTD3C
/METHOD=ENTER H3IR17 WHITE_ANCESTRY
/METHOD=ENTER PA12
/METHOD=ENTER H4ED2
/PARTIALPLOT ALL
/SCATTERPLOT=(*ZRESID ,*ZPRED)
/RESIDUALS DURBIN HISTOGRAM(ZRESID) NORMPROB(ZRESID)
/CASEWISE PLOT(ZRESID) OUTLIERS(3).
I applied the method of scaled weights (Osborne, 2011, p. 3) to restore the original sample size. We need to multiply the weight variable by the original N and divide it by the inflated N for each separate analysis. Applying weights is important because it makes the result more representative :
Definition: A sampling weight is a statistical correction factor that compensates for a sample design that tends to over- or under-represent various segments within a population. In some samples, small subsets of the population, such as religious, ethnic, or racial minorities, may be oversampled in order to have enough cases to analyze. When these subsamples are combined with the larger sample, their disproportionately large numbers must be diluted by a sampling weight.
Generally speaking however, I hardly found any large difference between weighted and unweighted results. It would be best to display the unweighted and weighted result. An important note, is that (in SPSS at least) the use of weights makes the p-values, and t-statistics, completely uninformative because SPSS seems to interpret the greatly inflated Ns as a real sample size.
[3] Self-identification in multiple waves has the advantage of minimizing the errors. Make sure your filter is activated when conducting regression or comparison of means programs.
Filter used for identifying blacks :
H1GI6B=1 and H3OD4B=1 and H3IR4=2 and H4IR4=2 and H3OD13=1
Filter used for identifying non-black/non-hispanic whites :
H1GI6A=1 and H1GI6B=0 and H1GI4=0 and H3OD4A=1 and H3OD4B=0 and H3OD2=0 and H3OD13=1
[4] There is no option in SPSS for performing a semi-partial correlation. But there is another way. Go to Analyze, Regression, Linear. Put your AHPVT variable in the ‘dependent’ box and your skin color variable in the ‘independent’ box. Check the ‘Save’ box, and then the ‘Standardized’ residuals. Run the regression. This will add a new variable in the bottom of the Data Editor page : an AHPVT variable with the effect of skin color on AHPVT removed. The last thing we have to do is to correlate (e.g., bivariate) the IQ-skin residual variable with the family ancestry variable. The result should be the same as shown in the above table.
[5] Go here for downloading the relevant variables in the NLS Investigator. Choose the NLSY97, go to Variable Search and select what you want in Browse Index, or go to Search and enter the key words (e.g. : born, asvab, sex, …). Download your collection of variables. Make sure you have extracted the NLSY files into a new file in your computer folder. Also, your handle file should look like this, or otherwise your syntax page will not be able to generate the variables.
[6] The syntax used is :
RECODE R1201300 (1=1) (2=2) into RUSBORN1.
VARIABLE LABELS RUSBORN1 1 ‘Yes’ 2 ‘No’.
EXECUTE.
RECODE S7642200 (1=1) (0=2) into RUSBORN2.
VARIABLE LABELS RUSBORN2 1 ‘Yes’ 2 ‘No’.
EXECUTE.
RECODE T0135800 (1=1) (0=2) into RUSBORN3.
VARIABLE LABELS RUSBORN3 1 ‘Yes’ 2 ‘No’.
EXECUTE.
RECODE T2110700 (1=1) (0=2) into RUSBORN4.
VARIABLE LABELS RUSBORN4 1 ‘Yes’ 2 ‘No’.
EXECUTE.
RECODE T3721700 (1=1) (0=2) into RUSBORN5.
VARIABLE LABELS RUSBORN5 1 ‘Yes’ 2 ‘No’.
EXECUTE.
COMPUTE RUSBORN =0.
IF R1201300 =1 or S7642200 =1 or T0135800 =1 or T2110700 or T3721700 =1 RUSBORN =1.
EXECUTE.
LIST R1201300 S7642200 T0135800 T2110700 T3721700 RUSBORN.
EXECUTE.
COMPUTE PARENT_WA=0.
IF R0552103=1 or R0552104=1 or R0552105=1 or R0552106=1 or R0552108=1 or R0552109=1 or R0552110=1 or R0552113=1 or R0552116=1 or R0552117=1 or R0552127=1 or R0552128=1 or R0552129=1 or R0552130=1 or R0552131=1 or R0552132=1 or R0552135=1 or R0552136=1 or R0552137=1 or R0552138=1 or R0552139=1 or R0552140=1 or R0552141=1 or R0552142=1 or R0552143=1 or R0552144=1 or R0552145=1 or R0552146=1 or R0552147=1 PARENT_WA=1.
EXECUTE.
COMPUTE PARENT_AA=0.
IF R0552101=1 or R0552111=1 or R0552150=1 PARENT_AA=1.
EXECUTE.
COMPUTE AFRICAN_ANCESTRY=0.
IF PARENT_WA=0 or PARENT_AA=1 AFRICAN_ANCESTRY=1.
EXECUTE.
COMPUTE WHITE_ANCESTRY=0.
IF PARENT_WA=1 or PARENT_AA=0 WHITE_ANCESTRY=1.
EXECUTE.
COMPUTE SPOUSE_WHITE=0.
IF R0555603=1 or R0555604=1 or R0555605=1 or R0555606=1 or R0555608=1 or R0555609=1 or R0555610=1 or R0555613=1 or R0555616=1 or R0555617=1 or R0555627=1 or R0555628=1 or R0555629=1 or R0555630=1 or R0555631=1 or R0555632=1 or R0555635=1 or R0555636=1 or R0555637=1 or R0555638=1 or R0555639=1 or R0555640=1 or R0555641=1 or R0555642=1 or R0555643=1 or R0555644=1 or R0555645=1 or R0555646=1 or R0555647=1 SPOUSE_WHITE=1.
EXECUTE.
COMPUTE SPOUSE_BLACK=0.
IF R0555601=1 or R0555650=1 SPOUSE_BLACK=1.
EXECUTE.
IF PARENT_AA=1 and SPOUSE_BLACK=1 F_ANCESTRY=0.
IF PARENT_WA=1 or SPOUSE_WHITE=1 F_ANCESTRY=1.
COMPUTE SKINCOLOR = SUM(T3173000, T4584700, T6217800).
EXECUTE.
IF R1302500=0 or R1302400=0 PARENTEDUC=0.
IF R1302500=1 or R1302400=1 PARENTEDUC=1.
IF R1302500=2 or R1302400=2 PARENTEDUC=2.
IF R1302500=3 or R1302400=3 PARENTEDUC=3.
IF R1302500=4 or R1302400=4 PARENTEDUC=4.
IF R1302500=5 or R1302400=5 PARENTEDUC=5.
IF R1302500=6 or R1302400=6 PARENTEDUC=6.
IF R1302500=7 or R1302400=7 PARENTEDUC=7.
IF R1302500=8 or R1302400=8 PARENTEDUC=8.
IF R1302500=9 or R1302400=9 PARENTEDUC=9.
IF R1302500=10 or R1302400=10 PARENTEDUC=10.
IF R1302500=11 or R1302400=11 PARENTEDUC=11.
IF R1302500=12 or R1302400=12 PARENTEDUC=12.
IF R1302500=13 or R1302400=13 PARENTEDUC=13.
IF R1302500=14 or R1302400=14 PARENTEDUC=14.
IF R1302500=15 or R1302400=15 PARENTEDUC=15.
IF R1302500=16 or R1302400=16 PARENTEDUC=16.
IF R1302500=17 or R1302400=17 PARENTEDUC=17.
IF R1302500=18 or R1302400=18 PARENTEDUC=18.
IF R1302500=19 or R1302400=19 PARENTEDUC=19.
IF R1302500=20 or R1302400=20 PARENTEDUC=20.
IF Z9083800=0 RGRADE=0.
IF Z9083800=1 RGRADE=1.
IF Z9083800=2 RGRADE=2.
IF Z9083800=3 RGRADE=3.
IF Z9083800=4 RGRADE=4.
IF Z9083800=5 RGRADE=5.
IF Z9083800=6 RGRADE=6.
IF Z9083800=7 RGRADE=7.
IF Z9083800=8 RGRADE=8.
IF Z9083800=9 RGRADE=9.
IF Z9083800=10 RGRADE=10.
IF Z9083800=11 RGRADE=11.
IF Z9083800=12 RGRADE=12.
IF Z9083800=13 RGRADE=13.
IF Z9083800=14 RGRADE=14.
IF Z9083800=15 RGRADE=15.
IF Z9083800=16 RGRADE=16.
IF Z9083800=17 RGRADE=17.
IF Z9083800=18 RGRADE=18.
IF Z9083800=19 RGRADE=19.
IF Z9083800=20 RGRADE=20.
COMPUTE PARENTAL_INCOME = SUM(R0609800, R0610100, R0610500, R0610800, R0611100, R0612700).
EXECUTE.
COMPUTE NH_WHITE =0.
IF R0538700 =1 and R0538600 =0 NH_WHITE =1.
EXECUTE.
USE ALL.
COMPUTE filter_$=(RUSBORN=1 and R1482600=1).
VARIABLE LABELS filter_$ ‘RUSBORN=1 and R1482600=1 (FILTER)’.
VALUE LABELS filter_$ 0 ‘Not Selected’ 1 ‘Selected’.
FORMATS filter_$ (f1.0).
FILTER BY filter_$.
EXECUTE.
COMPUTE ScaledWeights1 = (R1236201*538/68788524).
EXECUTE.
WEIGHT BY ScaledWeights1.
COMPUTE sqrtAFQT = SQRT(R9829600+1).
VARIABLE LABELS sqrtAFQT ‘square root of ASVAB’.
EXECUTE.
REGRESSION
/DESCRIPTIVES MEAN STDDEV CORR SIG N
/MISSING LISTWISE
/STATISTICS COEFF OUTS BCOV R ANOVA CHANGE ZPP
/CRITERIA=PIN(.05) POUT(.10)
/NOORIGIN
/DEPENDENT sqrtAFQT
/METHOD=ENTER SKINCOLOR F_ANCESTRY
/METHOD=ENTER PARENTEDUC
/PARTIALPLOT ALL
/SCATTERPLOT=(*ZRESID ,*ZPRED)
/RESIDUALS DURBIN HISTOGRAM(ZRESID) NORMPROB(ZRESID)
/CASEWISE PLOT(ZRESID) OUTLIERS(3).
COMPUTE ScaledWeights2 = (R1236201*428/55341076).
EXECUTE.
WEIGHT BY ScaledWeights2.
REGRESSION
/DESCRIPTIVES MEAN STDDEV CORR SIG N
/MISSING LISTWISE
/STATISTICS COEFF OUTS BCOV R ANOVA CHANGE ZPP
/CRITERIA=PIN(.05) POUT(.10)
/NOORIGIN
/DEPENDENT sqrtAFQT
/METHOD=ENTER SKINCOLOR F_ANCESTRY
/METHOD=ENTER PARENTEDUC PARENTAL_INCOME
/METHOD=ENTER RGRADE
/PARTIALPLOT ALL
/SCATTERPLOT=(*ZRESID ,*ZPRED)
/RESIDUALS DURBIN HISTOGRAM(ZRESID) NORMPROB(ZRESID)
/CASEWISE PLOT(ZRESID) OUTLIERS(3).
Just copy/paste it in your Syntax Editor (at the bottom of the page), and then click on Run, All. You can open it by clicking on File, New, Syntax. Don’t forget to specify in your filter that you want to restrict the sample to US born blacks. To do this, click on Data, Select Cases, and check “If condition is satisfied”. Click on “If”. And enter the following :
RUSBORN=1 and R1482600=1
Finally, use this code if you want to restrict the sample to US born non-hispanic whites :
RUSBORN=1 and NH_WHITE =1
[7] One must be careful when entering the syntax. Consider the following :
COMPUTE SPOUSE_BLACK=0.
IF R0555601=1 or R0555650=1 SPOUSE_BLACK=1.
EXECUTE.
The first line poses a problem. In a bivariate analysis, for example, the sample size for people having completed just the ASVAB test is the same as the number of people having completed both the ASVAB and the family ancestry questionnaires. This means that there is no missing value. This is highly unlikely. It seems that SPSS interpreted the first line so that subjects who have responded to those questionnaires and who did not are included. But if you use the following :
IF PARENT_AA=1 and SPOUSE_BLACK=1 F_ANCESTRY=0.
IF PARENT_WA=1 or SPOUSE_WHITE=1 F_ANCESTRY=1.
The sample size is reduced, but the estimate will be more accurate. I have tested it in another way by using, for example, the following variables : T6211904 (HEA29: FAM DISEASE – HIGH BLOOD PRESSURE 2010), T6211905 (HEA29: FAM DISEASE – HIGH CHOLESTEROL 2010). With the following coding :
COMPUTE XX=0.
IF T6211904=1 or T6211905=1 XX=1.
EXECUTE.
In other words, the coding is supposed to ask whether or not the respondent’s family had either one of these or both. How would the result look like ? I ran a comparison of means. Just look. For T6211904, T6211905 and my XX variable, the Ns are, respectively, 1249, 1231, and 7093. It smells fishy. This is why I am not using PARENT_AA or PARENT_WA in my analyses. As I coded my F_ANCESTRY variable, the first line of the other variables (e.g., COMPUTE PARENT_AA=0) is excluded in the equation.
This aside, what is said above must be kept in mind when you are trying to code some variables when using other datasets (e.g., Add Health…).

I saw an interview with James Heckman where he contends that the black/white IQ gap has shrunk down to only two thirds of a standard deviation – is that indeed the consensus? That sure doesn’t comport with what I’ve seen looking at NAEP scores and SAT results.
http://marginalrevolution.com/marginalrevolution/2013/02/interview-with-james-heckman.html
I reviewed a large portion of the literature in the first post on this blog:
https://humanvarieties.org/2013/01/15/100-years-of-testing-negro-intelligence/
My excel file can be found here:
https://humanvarieties.org/?attachment_id=47
For context, hereditarians typically argue that the genotypic d is 1, which implies, of course, a phenotypic d conditioned on genes of less than 1. For a discussion of this point, refer here:
http://occidentalascent.wordpress.com/2012/12/02/genotypic-iq/
Generally, the issue is complex because the Black-White gap varies by the genetic loading of a test. For a discussion of this, refer to sections G and H, here:
http://occidentalascent.wordpress.com/2012/06/10/the-facts-that-need-to-be-explained/
And the gap varies by age — increasing in line with increasing heritability. The upshot is that you can look at different sub-samples and derive different conclusions concerning secular changes.
Another issue is recent Black immigration. Here were the NLSY97 AFQT scores by immigrant status:
https://humanvarieties.org/2013/01/15/iqs-of-us-immigrants-in-the-nlsy97-whites-blacks-hispanics/
Based on this sample about 1/3rd of the claimed narrowing was due to an immigrant effect (i.e. a d value of 0.1). Another portion, of course, was an interbreeding effect (whether for cultural or genetic reasons, of course). When you take all of these various factors into account you might get a ‘true’ narrowing of d = 0.2 relative to a 1960s gap of d = 1.2. Whatever the case, you end up with a contemporaneous difference of about 1 SD averaged across ages.